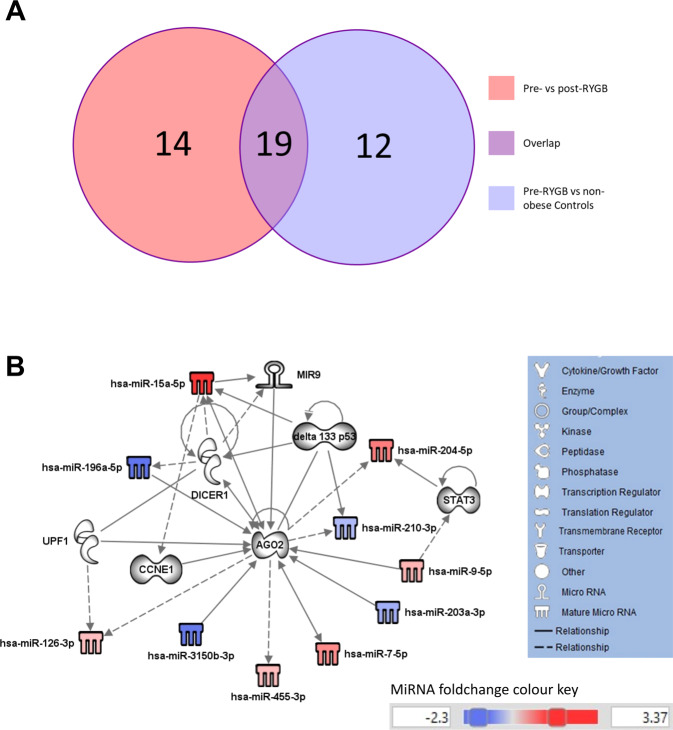
Fig. 3. Predicted target molecules are implicated in obesity and influenced by weight loss.
A Venn diagram showing the number of molecules (including miRNAs) identified in the comparison of obese patients pre- vs post-RYGB (total n = 33) and in the comparison of obese patients pre-RYGB vs non-obese Controls (total n = 31) and the number of overlapping molecules between the two comparison groups (total n = 19). B IPA Network of 19 overlapping miRNAs and predicted target molecules derived from miRNAs that were differentially expressed in patients with obesity vs non-obese Controls and in patients with obesity before and after RYGB.

