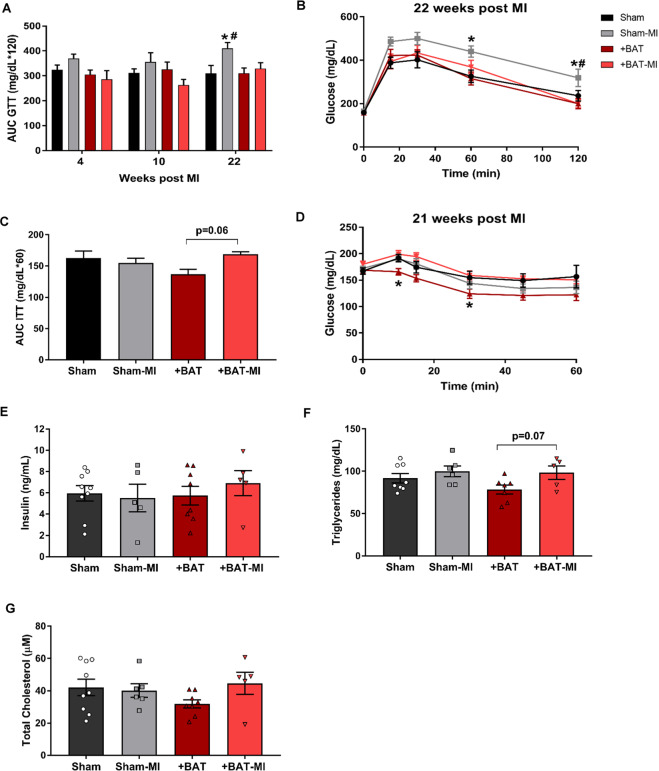
Fig. 3. BAT transplantation protects against glucose intolerance induced by MI.
Whole-body glucose homeostasis was assessed by glucose tolerance tests (GTT), and insulin tolerance test (ITT). A Area under curve (AUC) of glucose tolerance test (GTT) at weeks 4, 10, and 22 weeks post MI. B GTT excursion curve at 22 weeks post MI. C Insulin tolerance test (ITT) AUC at 21-weeks post MI. D ITT excursion curve at 21 weeks post MI. Biochemical measurements were performed after euthanasia at 22 weeks post MI: (E) Fasting insulin, (F) fasting triglycerides, and (G) total cholesterol (Sham n = 9, Sham-MI n = 5, +BAT n = 8, +BAT-MI n = 5). Data are presented as mean + S.E.M. Two-way ANOVA was used with Tukey’s multiple comparisons tests for (A, C, E, F, and G). Repeated measures two-way ANOVA was used for (B) and (D) with Tukey’s multiple comparisons tests. * symbols represent difference of Sham-MI or +BAT vs. Sham mice (*p < 0.05). # symbols represent difference of Sham-MI versus +BAT-MI mice (#p < 0.05).

