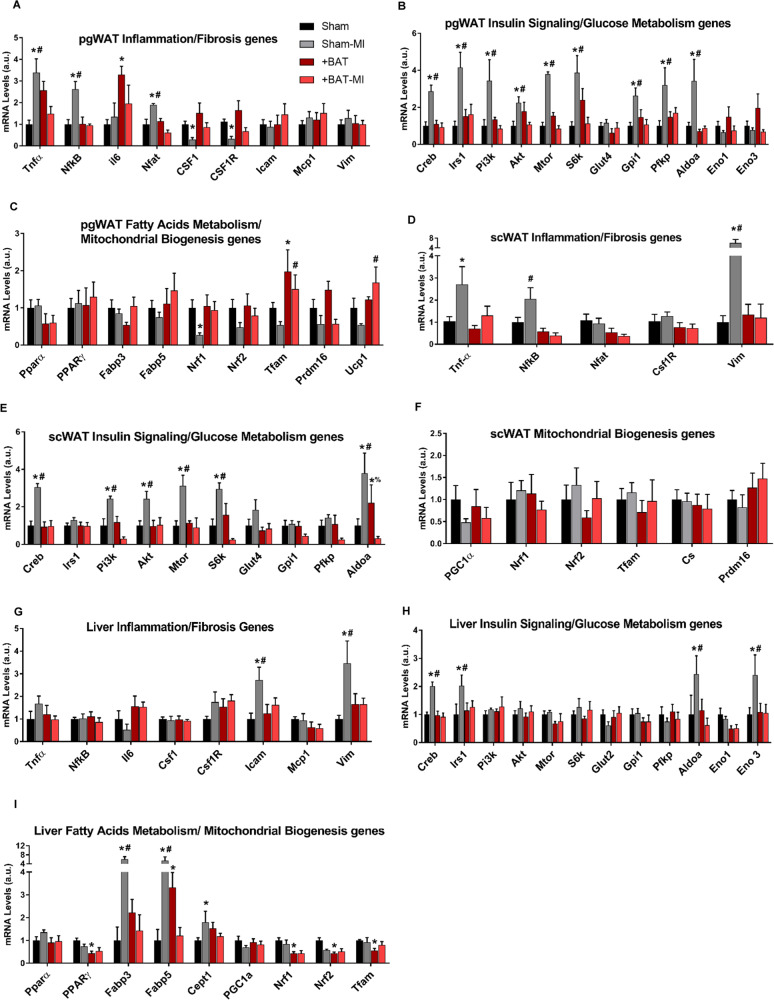
Fig. 4. BAT attenuates expression of genes involved in inflammation and insulin resistance increased by MI in white adipose tissue and liver.
Quantitative PCR (qPCR) was performed on tissue isolated from mice that were sacrificed at 52 weeks of age (22 weeks post-MI). Genes related to inflammation and fibrosis, insulin signaling and glucose metabolism, fatty acid metabolism, and mitochondrial biogenesis were accessed in (A–C) pgWAT, (D–F) scWAT, and (G–I) liver of Sham (n = 8), Sham-MI (n = 3–5), +BAT (n = 5–8), and +BAT-MI (n = 4–5). Data are presented as mean + S.E.M (n = 5–9/group). Two-way ANOVA was used with Tukey’s multiple comparisons tests. *symbols represent the difference of Sham-MI or +BAT vs. Sham mice (*p < 0.05). # symbols represent difference of Sham-MI versus +BAT-MI mice (#p < 0.05).

