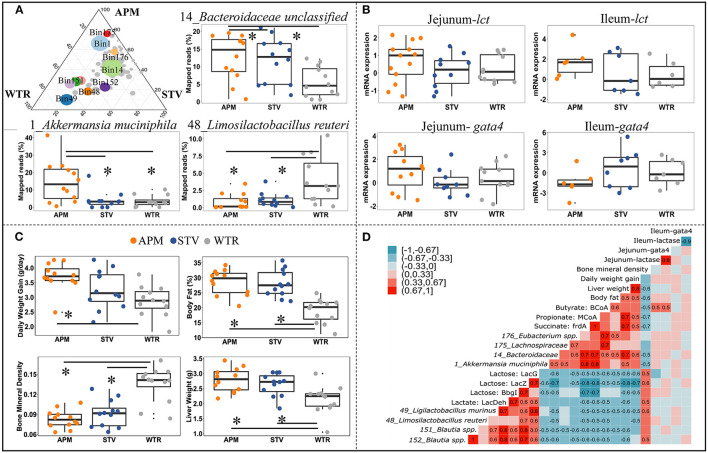
Figure 5.
Connections between cecal microbiome alterations and host parameters in 3-week old offspring. The top 10 influenced genomes in cecal microbiota of 3-week-old offspring (ternary plot) and the relative abundance of 3 representative influenced genomes (boxplots) (A); mRNA expression fold change of jejunal/ileal lactase gene (lct) and GATA4 (gata4) (B); Growth peformance and body composition of weanlings (C); The coefficient matrix of Spearman's rank correlations between the most influenced genomes, metabolic enzymes, gene expression, and the corresponding growth and body composition of 3-week old offspring (D). Data with asterisk (*) represents significant difference (p < 0.05). APM, aspartame; STV, stevia; WTR, water control.

