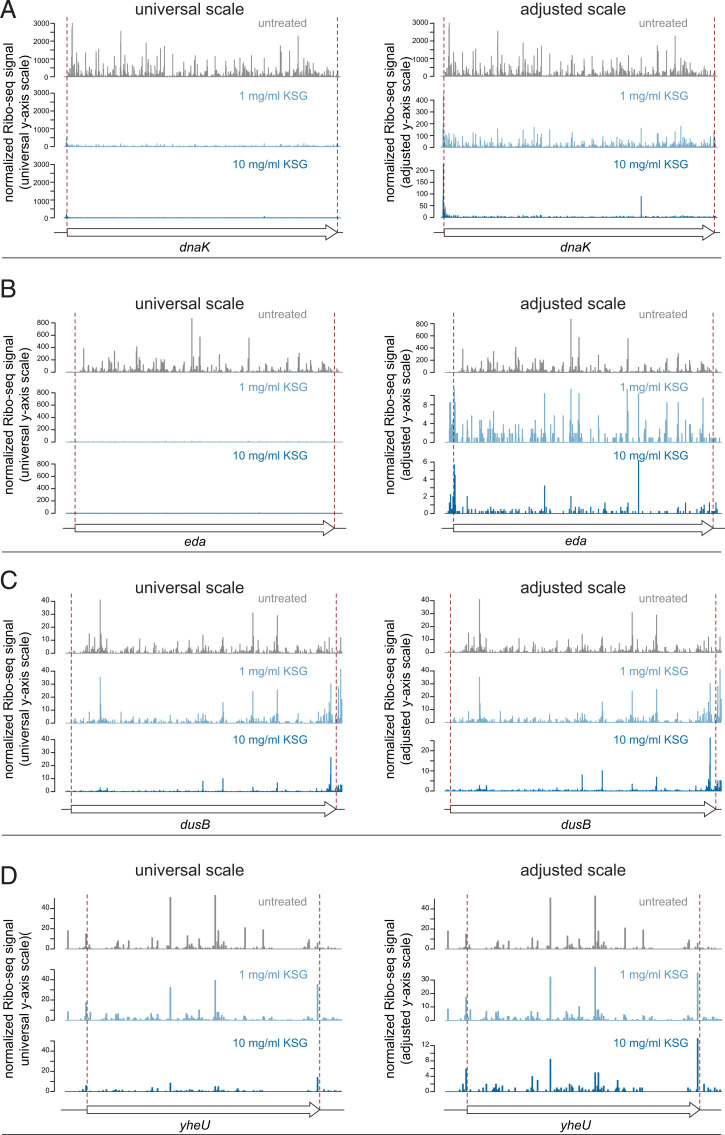
Fig. 2.
Diverse effect of KSG on translation of E. coli genes. Examples of genes whose translation is strongly inhibited by KSG (A and B) or only moderately affected by the drug (C and D). For each gene, the relative ribosome occupancies for the control and antibiotic-treated samples are shown using the universal y axis scale (Left) or adjusted y axis scales (Right), which reveals residual translation of the ORF. The relative ribosome occupancy (normalized Ribo-seq signal) was calculated from Ribo-seq signals normalized by the mRNA abundance (reads per kilobase per million [RPKM] calculated from RNA-seq) and adjusted by the overall level of translation inhibition (quantified by [35S]-L-methionine labeling). The beginning and the end of the coding sequence are indicated by red dashed lines.

