Fig. 3.
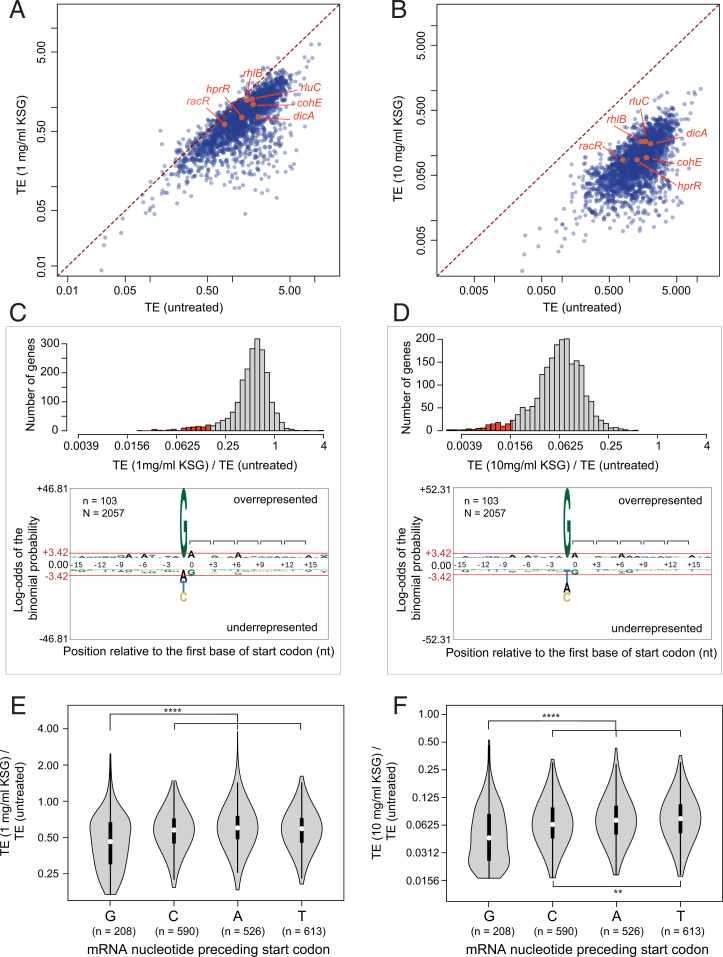
Start codon context plays a key role in gene-specific effect of KSG. (A and B) Comparison of TE of genes between untreated cells with those treated with 1 mg/mL (A) or 10 mg/mL (B) KSG for 2.5 min. The known leaderless genes, rhlB, rluC, racR, hprR, dicA, and cohE (SI Appendix, Supplementary Results and Discussion) are highlighted in orange. (C and D) (Top) The distribution of TE change of expressed genes (n = 2,057) upon treatment with 1 mg/mL (C) or 10 mg/mL (D) KSG for 2.5 min. The top 5% most inhibited genes (marked in red, n = 103) are characterized by the preferential occurrence of guanine immediately upstream of the start codons as revealed by pLogo analysis (59). Brackets in the pLogo plots mark the mRNA codons. (E and F) Violin plots comparing the distribution of TE changes upon 1 mg/mL (E) or 10 mg/mL (F). This analysis excludes the genes most susceptible to KSG inhibition (top 5%, highlighted in C and D). Significance values from pair-wise Mann–Whitney U test with Bonferroni adjustment are indicated as **P < 0.01; ****P < 0.0001.

