Fig. 5.
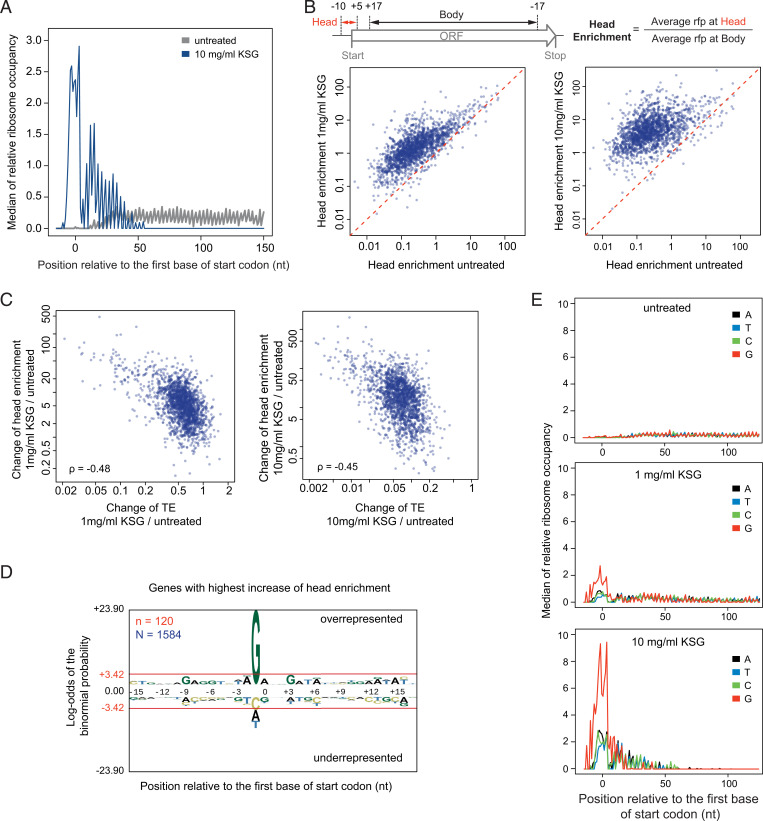
KSG treatment leads to ribosome enrichment in vicinity of the start codon. (A) Metagene analysis (see Materials and Methods for details) of the median rfp density in the vicinity of start codons in untreated cells and cells treated with 10 mg/mL of KSG. (B) (Top) Schematic for calculating the head enrichment; (Bottom) comparison of the change in head enrichment of different genes upon treatment of 1 mg/mL KSG (Left) or 10 mg/mL KSG (Right) versus untreated control. (C) Comparisons of changes of TE versus changes of head enrichment upon treatment with 1 mg/mL KSG (Left) or 10 mg/mL KSG (Right). ρ: Spearman’s rank correlation coefficient. (D) Genes with the highest head enrichment are characterized by the preferential presence of G preceding the start codon. Sequence signatures are generated by pLogo analysis of the top 10% genes shared between the two KSG-treated samples (n = 120) out of 1,584 analyzed. Bases above or below the red line are significantly overrepresented or underrepresented, respectively. (E) Metagene analysis of the median rfp density in the vicinity of start codons in untreated and KSG-treated cells plotted in different colors for mRNAs with different residues preceding the start codon.

