Fig. 4.
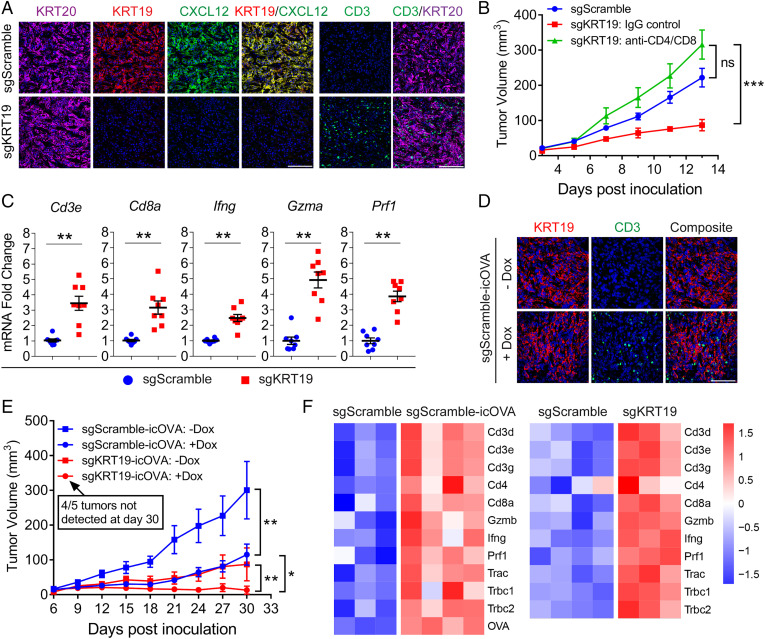
The immunological responses of tumors formed with Krt19-edited mouse PDA cells. (A) Sections of s/c tumors formed with sgScramble control PDA cells and sgKRT19-edited PDA cells were stained with fluorochrome-conjugated antibodies to KRT20, KRT19, CXCL12, and CD3. (Scale bars, 100 µm.) (B) Growth curves are shown of s/c tumors formed with sgScramble control PDA cells and sgKRT19-edited PDA cells in mice that were untreated or treated with either nonimmune IgG or T cell–depleting antibodies to CD4 and CD8; n = 5. (C) The mRNA levels of immune genes in tumors formed with sgKRT19-edited PDA cells were compared to those of tumors formed with sgScramble control PDA cells; n = 8. (D) Sections of s/c tumors formed with sgScramble control PDA cells without or with Dox-induced icOVA expression were stained with fluorochrome-conjugated antibodies to KRT19 and CD3. (Scale bar, 100 μm.) (E) Growth curves are shown of s/c tumors formed with sgScramble control PDA cells or sgKRT19-edited PDA cells without or with Dox-induced icOVA expression; n = 5; mean ± SEM; ns, not significant, *P < 0.05, **P < 0.01, ***P < 0.001; Student’s t test. (F) The heat map depicts the relative expression of immune genes as assessed by RNA-seq assay of individual s/c tumors formed with paired sgScramble control PDA cells with icOVA-expressing sgScramble control PDA cells and paired sgScramble control PDA cells with sgKRT19-edited PDA cells.

