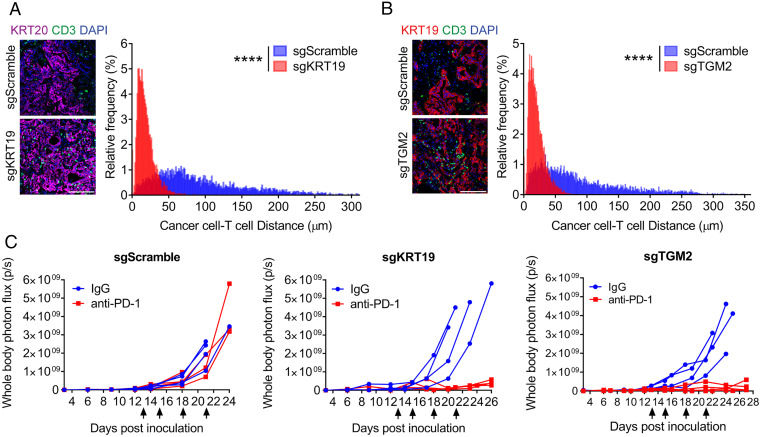
Fig. 6.
Responses of hepatic metastases formed with control, Krt19-edited, or Tgm2-edited PDA cells to treatment with anti–PD-1 antibody. (A and B) Sections of hepatic metastases formed with luciferase-expressing sgScramble control PDA cells, sgKRT19-edited (A), or sgTGM2-edited (B) PDA cells were stained with fluorochrome-conjugated antibodies to KRT20 or KRT19 to reveal cancer cells and with CD3 to reveal T cells. The distance of each cancer cell from the nearest T cell was calculated for entire cross-sections, and the distance distribution of the sgScramble control tumors and their matching sgKRT19 or sgTGM2 tumors were plotted. (Scale bars, 100 µm.) More than 4,000 cancer cells from two to seven tumor sections of each group were analyzed; ****P < 0.0001, Kolmogorov–Smirnov test. (C) Mice bearing hepatic metastases formed with these luciferase-expressing PDA cells were treated with nonimmune IgG or anti–PD-1 IgG (arrows), and growth of the metastases was measured by bioluminescent imaging.

