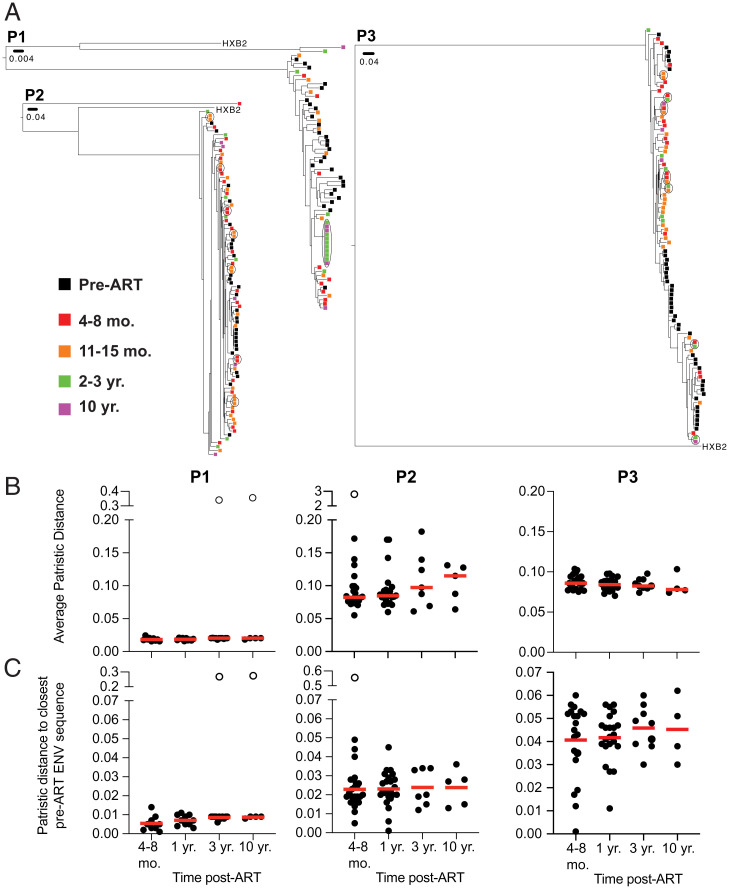
Fig. 2.
Proviruses detected in circulation prior to ART are distinct from intact proviruses detected in latent reservoir found in PBMCs. (A) Phylogenetic tree of env sequences of intact proviruses in the latent reservoir and pre-ART proviruses found in circulation found in participants P1–P3. Branch lengths are proportional to a genetic distance (Scale bar indicated below sample ID). Black outlines indicate clones. Color of squares represent the origin of the sequence, as indicated by the key on the Left. (B) Graph showing average patristic distance between each intact provirus found in the reservoir compared to every pre-ART virus found in circulation, comparing different time points post-ART. Each dot represents one intact provirus found in the reservoir. (C) Graph showing distance of intact proviruses found in the latent reservoir to the closest pre-ART env sequence. Each dot represents one intact provirus found in the reservoir. Participant name is specified above graphs. Unfilled dots indicate outliers that were excluded from the analysis. Horizontal red line indicates the median patristic distance at each time point. Grubb’s test was used to calculate outliers, and a Kruskal–Wallis test with subsequent Dunn’s multiple comparisons was used to analyze data where appropriate.

