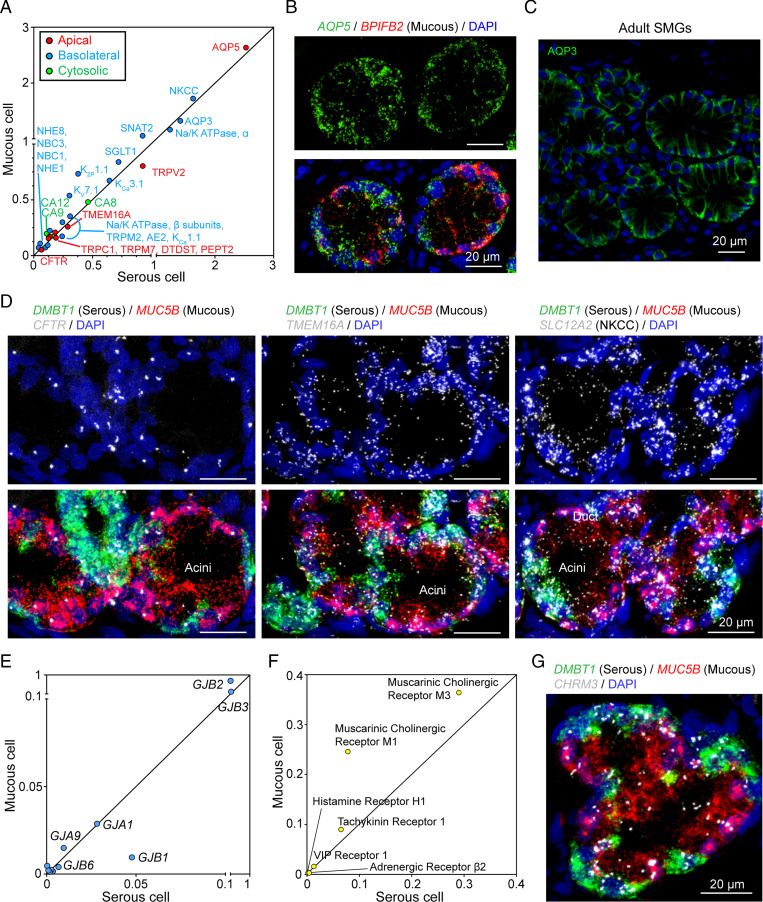
Fig. 5.
Acinar serous and mucous cells express similar transcripts for ion transporters. (A) Scatter plot of mean expression of transepithelial ion transporters in mucous and serous cells at natural log scale. Different colors represent different subcellular localization of indicated transporters. (B and C) Representative images of aquaporin staining in SMG acini. In B, AQP5 is equally distributed in BPIFB2+ (mucous) cells and BPIFB2− (serous) cells. In C, AQP3 protein is localized on the basolateral side of all acinar cells of adult SMGs. (D) Representative images of the expression pattern of key ion transporters (CFTR, TMEM16A, NKCC) in the acinus of SMGs. Serous cells (DMBT1+) are shown in green; mucous cells (MUC5B+) are shown in red. (E) Scatter plot of the expression of gap junction genes in serous and mucous cells. The line across the plot indicates equal expression of genes between serous and mucous cells. (F) Scatter plot of mean expression of secretory-related receptors in mucous and serous cells at natural log scale. (G) Representative image of smFISH of CHRM3 (gene for muscarinic cholinergic receptor M3) in SMG acini. DMBT1 (green) and MUC5B (gray) are markers for serous cells and mucous cells, respectively.

