Fig. 1.
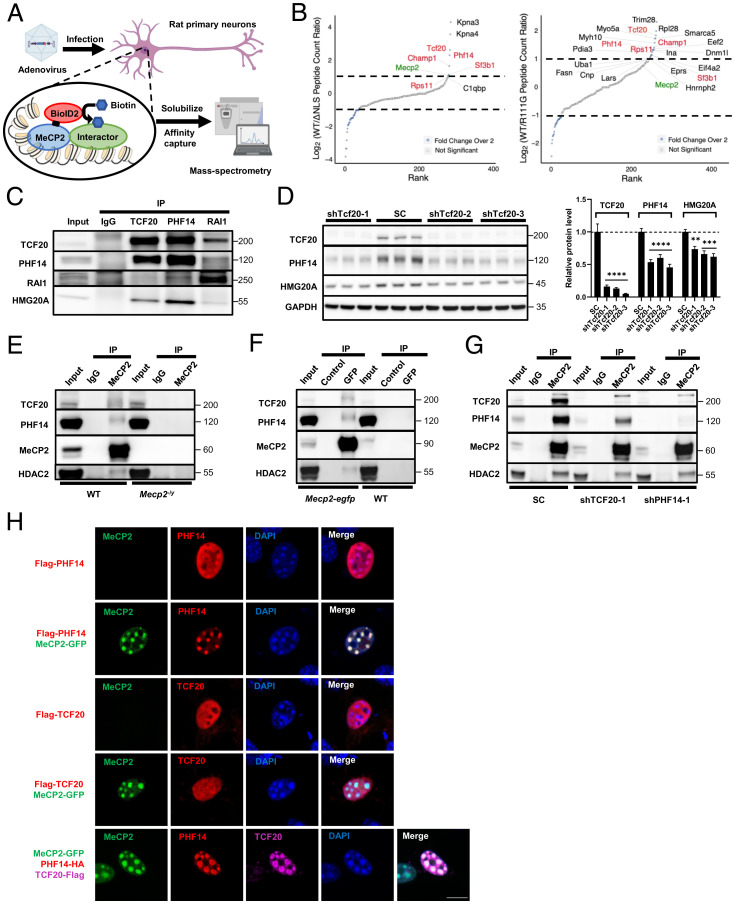
MeCP2 interacts with the TCF20 complex in vitro and in vivo. (A) The experimental strategy using BioID2-dependent proximity biotinylation to identify MeCP2 interactors. (B) Rank plots showing the enrichment of MeCP2-BioID2 peptide spectral matches (PSMs) over MeCP2ΔNLS-BioID2 (Left) and MeCP2R111G-BioID2 (Right) PSMs. BioID2-tagged protein (MeCP2) is indicated in green, proteins shown enrichment in both experiments are indicated in red. Only proteins with more than 10 peptide counts collected in the WT sample were plotted. Proteins with fewer than 10 peptide counts, such as RAI1, ATRX, and two components of the NCoR1/2 complex, TBL1XR1 and TBL1X, were not shown in the plots, although they were enriched for twofold or more compared to at least one negative controls (full lists of the peptides collected in the BioID MS is given in Dataset S1). (C) Representative immunoblot of TCF20, PHF14, RAI1, and HMG20A protein levels following IP of TCF20, PHF14 or RAI1 from mouse cortical lysates. (D) Representative immunoblot (Left) and quantification (Right) of TCF20, PHF14, and HMG20A protein levels following Tcf20 knockdown or scramble control (SC) in HEK293T cells (n = 3 per group; two-way ANOVA with post hoc Tukey’s tests). **P < 0.01, ***P < 0.001, ****P < 0.0001; data are mean ± SEM. (E and F) Representative immunoblots of TCF20, PHF14, and HDAC2 protein levels following IP of MeCP2 from WT and Mecp2-null cortical lysates (E) or GFP from Mecp2-egfp and WT cortical lysates (F). GFP-Trap Dynabeads (GFP) and control Dynabeads (Control) were used to IP GFP-tagged MeCP2 in F. (G) Representative immunoblot of TCF20, PHF14, and HDAC2 protein levels following IP of MeCP2 from HEK293T cells transduced with a nontargeting scramble (SC) lentivirus or lentiviral shRNA targeting TCF20 or PHF14. (H) Representative immunocytochemical images in mouse 3T3 fibroblasts showing the colocalization of Flag-tagged PHF14, Flag-tagged TCF20, or both HA-tagged PHF14 and Flag-tagged TCF20 relative to densely methylated heterochromatic foci (stained by DAPI) upon overexpression of MeCP2-GFP. (Scale bar, 10 µm.)

