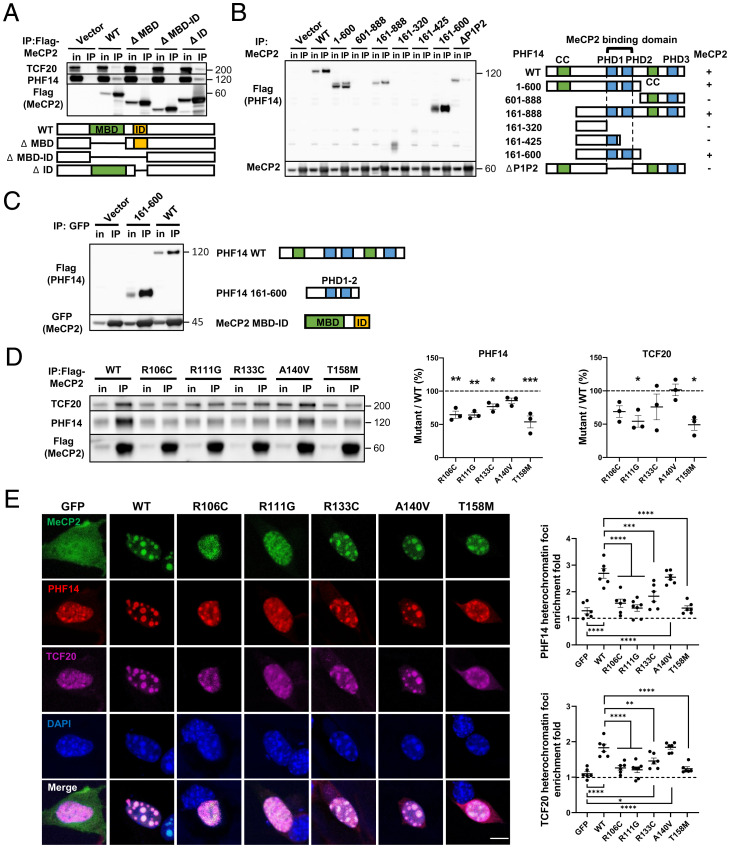
Fig. 2.
RTT-causing mutations in the MeCP2 MBD disrupt interactions with the TCF20 complex. (A) Representative immunoblot of TCF20 and PHF14 protein levels following IP of Flag-tagged WT and truncated MeCP2 in HEK293T cells. (B) Representative immunoblot (Left) and summary of the co-IP results (Right) of Flag-tagged WT and truncated PHF14 protein variants following IP of MeCP2 in HEK293T cells. The “+/−” denotes the presence (+) or absence (−) of MeCP2 interaction. (C) Representative immunoblot of Flag-tagged WT and truncated PHF14 (PHD1-2) proteins following IP of GFP-tagged truncated MeCP2 (MBD–ID) in HEK293T cells. (D) Representative immunoblot (Left) and quantification (Center and Right) of TCF20 and PHF14 protein levels following IP of Flag-MeCP2 variants in HEK293T cells. The abundance of the co-IP TCF20 and PHF14 was normalized to that of IP MeCP2 to quantify the interaction between TCF20/PHF14 and WT or mutant MeCP2. The ratio of normalized TCF20/PHF14 of each mutant to that of WT was calculated as the percentage of mutant/WT (n = 3 per group, one-way ANOVA with post hoc Tukey’s test). (E) Representative immunocytochemical images (Left) and quantification (Right) of HA-tagged PHF14 and Flag-tagged TCF20 enrichment to densely methylated heterochromatic foci (stained by DAPI) upon overexpression of WT and mutant MeCP2-GFP in mouse 3T3 fibroblasts. The heterochromatin foci enrichment fold was calculated as the ratio of mean gray value within foci area to mean gray value outside of foci area (n = 6 per group, one-way ANOVA with post hoc Tukey’s test). (Scale bar, 10 µm.) *P < 0.05, **P < 0.01, ***P < 0.001, ****P < 0.0001; data are mean ± SEM.

