Fig. 4.
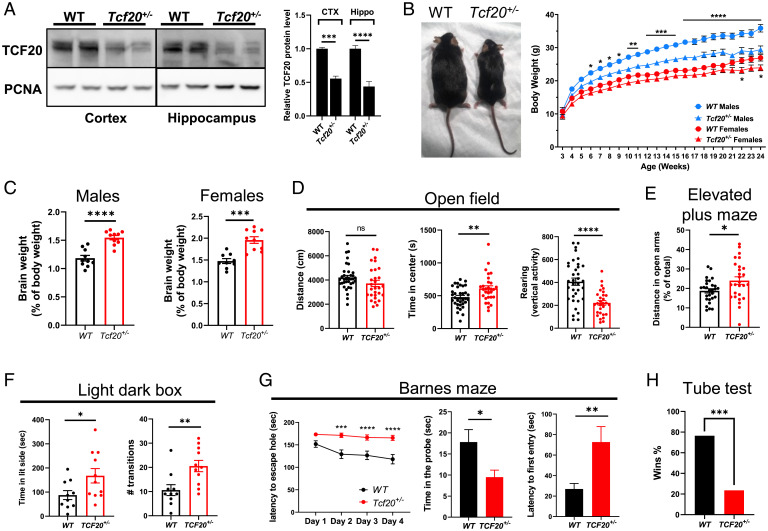
Haploinsufficiency in Tcf20 results in learning and memory deficits and autism-like phenotypes in mice. (A) Representative immunoblot (Left) and quantification (Right) of TCF20 protein levels in the cortex (CTX) and hippocampus (Hippo) from WT and Tcf20+/− mice (n = 3 per group, two-way ANOVA with post hoc Tukey’s tests). (B, Left) A photograph showing the body size of WT and Tcf20+/− mice at 8 mo of age. (Right) Body weights of WT and Tcf20+/− mice over the course of 24 wk. (For males, WT, n = 22, Tcf20+/−, n = 17; for females, WT, n = 21, Tcf20+/−, n = 14; two-way ANOVA with post hoc Tukey’s tests.) (C) Brain weights of adult WT and Tcf20+/− mice after being normalized to body weights. (For males, WT, n = 10, Tcf20+/−, n = 10; for females, WT, n = 9, Tcf20+/−, n = 10; unpaired two-tailed Student’s t test.) (D) Statistical analysis of open field test for WT and Tcf20+/− male mice. (Left) Total mouse movement in 30 min; (Center) time spent in the center area; (Right) time spent for vertical exploring (rearing) (WT, n = 35, Tcf20+/−, n = 29; unpaired two-tailed Student’s t test). (E) Statistical analysis of time spent in the open arm for WT and Tcf20+/− male mice in the elevated plus maze (WT, n = 28, Tcf20+/−, n = 27; unpaired two-tailed Student’s t test). (F) Statistical analysis of light–dark box test for WT and Tcf20+/− male mice. (Left) Time spent in the light side; (Right) the number of transitions between the two compartments (WT, n = 10, Tcf20+/−, n = 11; unpaired two-tailed Student’s t test). (G) Statistical analysis of Barnes maze for WT and Tcf20+/− male mice. (Left) Time spent to locate the escape hole during 4 d of training; (Center) time spent in the probe (escape hole) area during the test day; (Right) latency to first enter the escape hole during the test day (WT, n = 22, Tcf20+/−, n = 23, two-way ANOVA with post hoc Tukey’s tests for training, unpaired two-tailed Student’s t test for probe test). (H) Percentage of wins in test pairs between WT and Tcf20+/− male mice in the tube test (n = 51 matches, two-tailed binomial test). *P < 0.05, **P < 0.01, ***P < 0.001, ****P < 0.0001; data are mean ± SEM.

