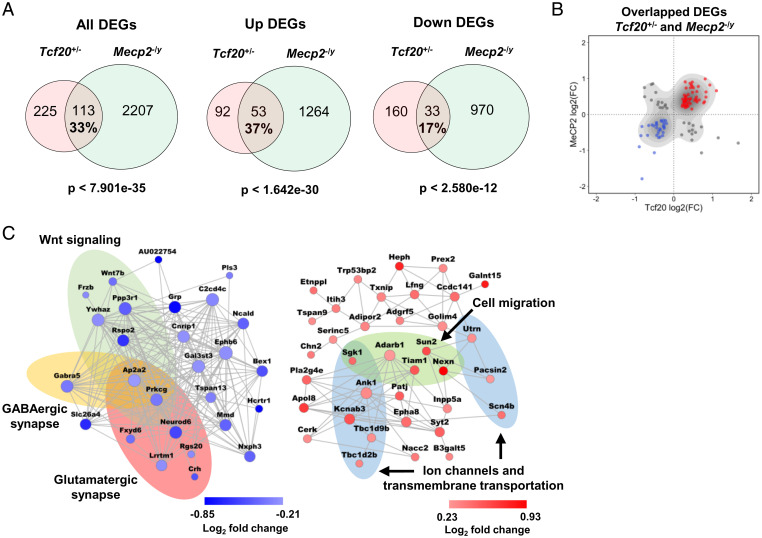
Fig. 5.
MeCP2 and TCF20 share common downstream neuronal genes and pathways. (A) Venn diagrams showing DEGs common to Tcf20+/− and Mecp2–/y mouse models; (Left) all DEGs; (Center) up-regulated DEGs; (Right) down-regulated DEGs (full lists of Tcf20+/− and Mecp2–/y DEGs are given in Datasets S2 and S3, respectively). The percentage rate indicates the ratio of the number of overlapped DEGs to the number of Tcf20+/− DEGs. (B) Scatter plot showing log2 fold-change for overlapped DEGs in Tcf20+/− vs. Mecp2–/y mouse models. Majority of the DEGs common to Tcf20+/− and Mecp2–/y mouse models changed in the same direction. (C) Coexpression networks of the down- (Left, blue) and up-regulated (Right, red) overlapped genes between Tcf20+/− and Mecp2–/y mouse models. Colored ellipses indicate the enriched gene ontology terms or pathways in each network. Node size is proportional to coexpression degree. Node color reflects log2 fold-change in Tcf20+/− mice.

