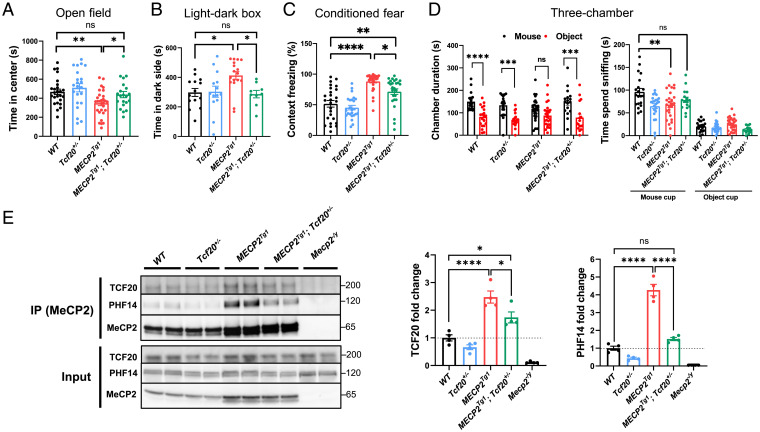
Fig. 6.
Genetic reduction of Tcf20 improves behavioral deficits in MECP2 duplication mice. (A) Statistical analysis of open field test showing time spent in the center area for mice with the indicated genotypes (n = 21 to 29 per genotype, one-way ANOVA with post hoc Tukey’s tests). (B) Statistical analysis of light–dark box test for mice with the indicated genotypes (n = 9 to 17 per genotype, one-way ANOVA with post hoc Tukey’s tests). (C) Altered learning and memory in conditioned fear test for mice with the indicated genotypes (n = 19 to 26 per genotype, one-way ANOVA with post hoc Tukey’s tests). (D) Statistical analysis of three-chamber test for mice with the indicated genotypes. (Left) Time the mice stay in chambers with the partner mouse or with the inanimate object; (Right) time the mice spent interacting with the partner mouse (n = 16 to 27 per genotype). (Left) Two-way ANOVA with post hoc Tukey’s tests; (Right) one-way ANOVA with post hoc Tukey’s tests. (E) Representative immunoblot (Left) and quantification (Right) of TCF20, PHF14 following IP using antibodies to MeCP2 from mouse cortex of each genotype. Mecp2–/y as negative controls. The ratio of co-IP TCF20 and PHF14 from each indicated genotypes to that of WT is calculated as fold-change (n = 4 per group, one-way ANOVA with post hoc Tukey’s tests) *P < 0.05, **P < 0.01, ***P < 0.001, ****P < 0.0001; data are mean ± SEM. ns, not significant.

