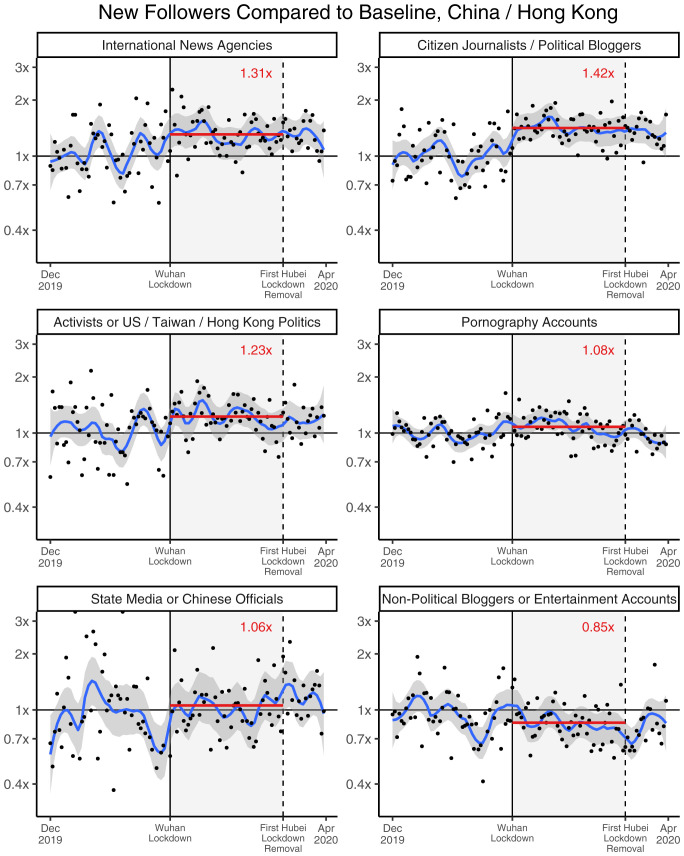
Fig. 5.
Increases in Twitter followers from China vs. Hong Kong by category. Shown is the gain in followers from mainland China compared to Hong Kong across six types of popular accounts, relative to December 2019 trends. Ratios here approximate the incidence rate ratios estimated in the models for Fig. 6. Each dot represents that category-day’s ratio. The blue lines indicate the moving averages, and the red lines represent the average during Wuhan lockdown. A value greater than 1 means more followers than expected from mainland China than from Hong Kong. Accounts creating sensitive, censored information receive more followers than expected once the Wuhan lockdown starts. Accounts that are not sensitive or censored, such as state media or entertainment, do not see greater than expected increases.

