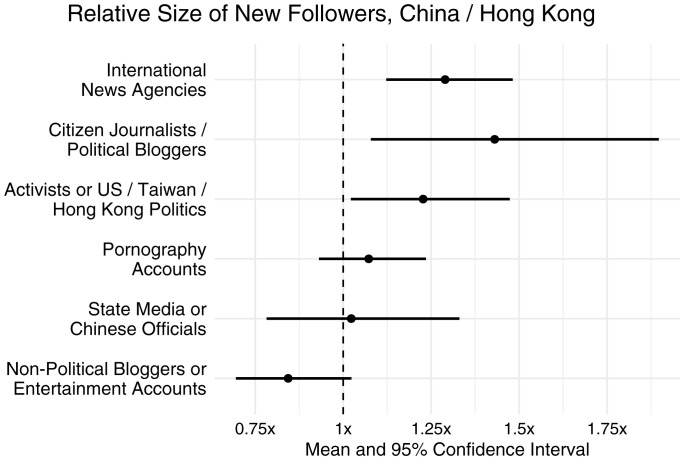
Fig. 6.
Increases in Twitter followers in China vs. Hong Kong by category (regression estimate). Incidence rate ratios shown are from negative binomial regressions of number of new followers on the interaction between indicator variables for “in lockdown period” and “in mainland China,” with December 2019 as control period and Hong Kong as control group.

