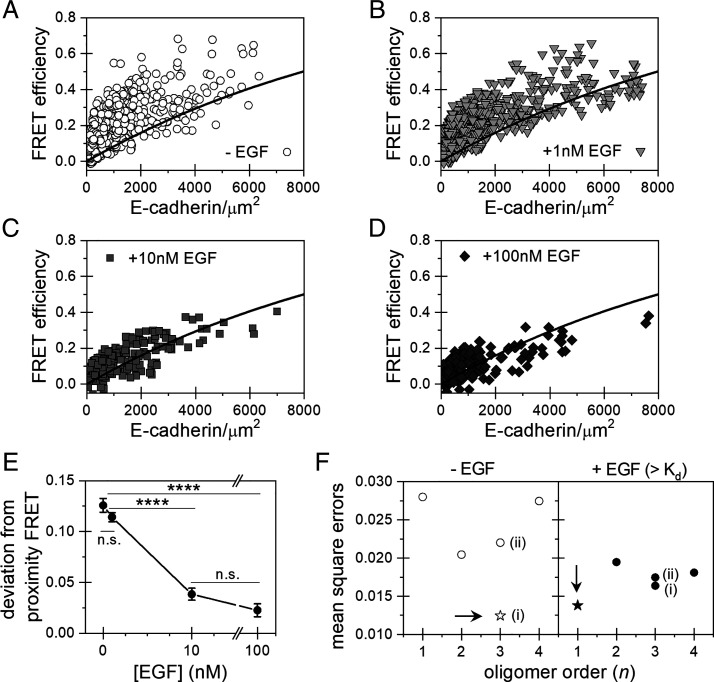
Fig. 5.
FSI-FRET measurements of E-cadherin interactions with EGFR, in the absence and presence of different concentrations of EGF. (A–D) Plot of the E-cadherin/EGFR FRET efficiencies versus surface E-cadherin concentrations in the absence (A) or presence of (B) 1 nM, (C) 10 nM, (D) or 100 nM of EGF. The black curve is the proximity FRET void of specific interactions (48). Data Above the line are indicative of direct receptor interactions. (E) The FRET efficiencies were corrected for the contribution of the modeled proximity FRET and represented as the deviation from the proximity FRET. The deviations from the proximity FRET were calculated and plotted as histograms (SI Appendix, Fig. S8). The mean values and SEs are plotted as a function of EGF concentration. Errors that are not visible are smaller than the size of the symbol. Significance was calculated by ANOVA. (****P < 0.0001 and n.s., P ≥ 0.05). (F) MSEs calculated by comparing various hetero-oligomerization models with the FRET data. The model which minimizes the MSE is the most probable complex size and stoichiometry, indicated as a star and by an arrow. The two different heterotrimer models are (i) one EGFR and two E-cadherin or (ii) two EGFR and one E-cadherin.

