Fig. 2.
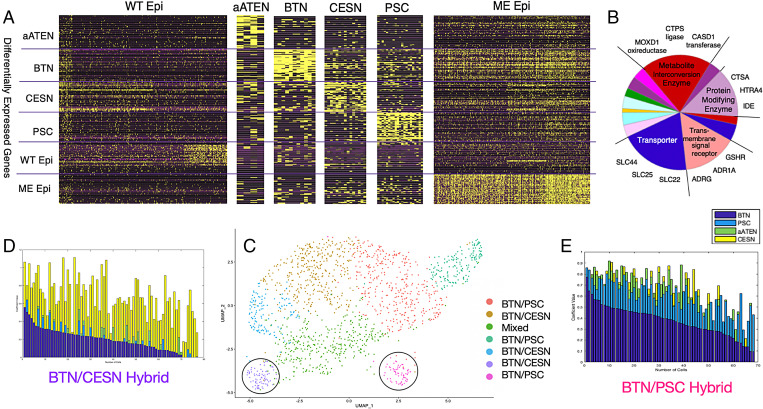
Quantitative characterization of wild-type and POU IV–misexpressed epidermis gene expression patterns. (A) Visualization of expression levels of 300 transcriptomic profile genes of wild-type epidermis and aATEN, BTN, CESN, PSC, and POU IV ME cell populations. Rows are the top 50 DEGs from each cell-type population (300 transcriptomic profile). Columns are individual cells. (B) Pie chart of the main PANTHER protein classes of ME DEGs and representative genes belonging to each class that define the various subclusters. More detailed information is provided in SI Appendix, Fig. S10. (C) UMAP visualization of seven subclusters generated from Louvain community–based clustering of ME cells. Circled purple and pink clusters contain representative BTN/CESN and BTN/PSC hybrid cells, respectively. (D and E) Stacked barplots of cell type–specific solved coefficients (Materials and Methods) for each cell in BTN/PSC and BTN/CESN subclusters, respectively. Solved aATEN, BTN, CESN, and PSC coefficients are represented by green, dark blue, yellow, and light blue bars, respectively. Cells are ordered by decreasing values of BTN solved coefficients, that is, “decreasing BTN character” and “increasing PSC/CESN character.”

