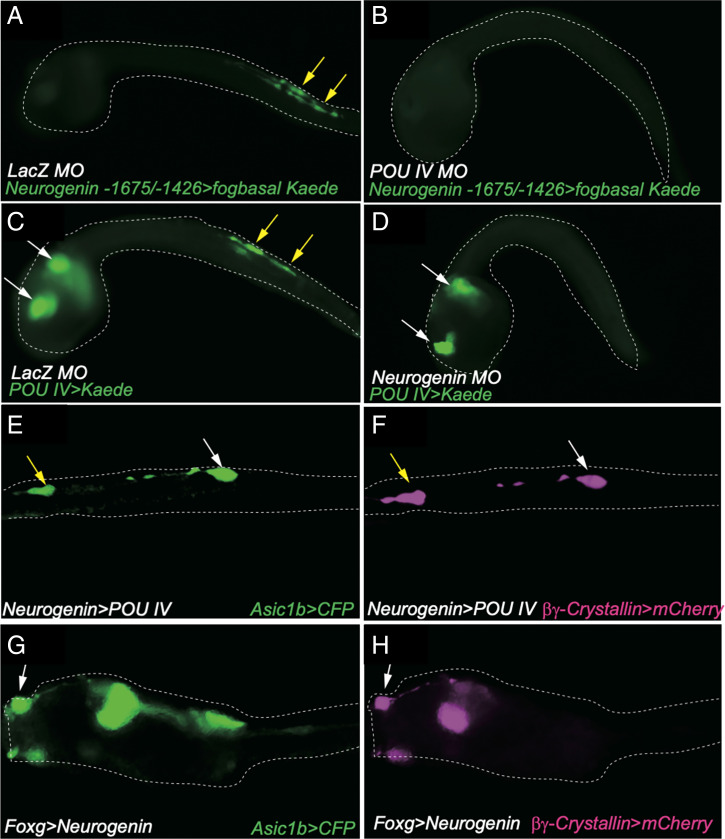
Fig. 4.
Positive feedback loop between POU IV and Neurogenin in BTN and synthetic cell-type specifications. (A and B) Kaede fluorescence of Neurogenin -1675/-1472bp>Kaede–injected embryos. (A) Kaede fluorescence in BTNs in LacZ MO–injected embryos. Yellow arrows indicate Kaede fluorescence in BTNs. (B) Same as A except that larvae were injected with the POU IV MO. (C and D) Kaede fluorescence of POU IV>Kaede–injected embryos. (C) Kaede fluorescence in BTNs and CNS in LacZ MO–injected embryos. Yellow and white arrows indicate Kaede fluorescence in BTNs and CNS, respectively. (D) Same as C except that larvae were injected with the Neurogenin MO. Kaede fluorescence disappears in BTNs but is maintained in the CNS. (E and F) Misexpression of POU IV in BTNs leads to expression of the PSC marker gene (βγ-Crystallin) in BTNs. Asic1b>CFP expression (E) and βγ-Crystallin>mCherry (F) expression in Neurogenin>POU IV–injected larvae. (G and H) Misexpression of Neurogenin in PSCs leads to expression of the BTN marker gene (Asic1b) in PSCs. Asic1b>CFP expression (G) and βγ-Crystallin>mCherry (H) expression in Foxg>Neurogenin–injected larvae.

