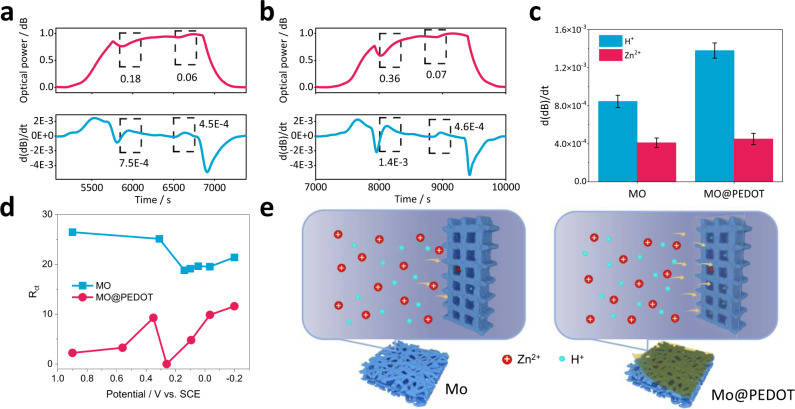
Fig. 5. Investigation of kinetics in H+ and Zn2+ intercalation.
SPR power curve (red) and time derivative of light power (blue) at the discharge stage of a MO and b MO@PEDOT electrodes. c The change rate of normalized optical rate curves and d Rct at different voltages of MO and MO@PEDOT electrodes during discharge process. Vertical error bars show the standard deviation from five continuous charging/discharging cycles. e The mechanism of PEDOT layer promoting H+ diffusion kinetics. The abundance of O and S functional groups in the PEDOT layer promotes ion diffusion kinetics, especially H+.

