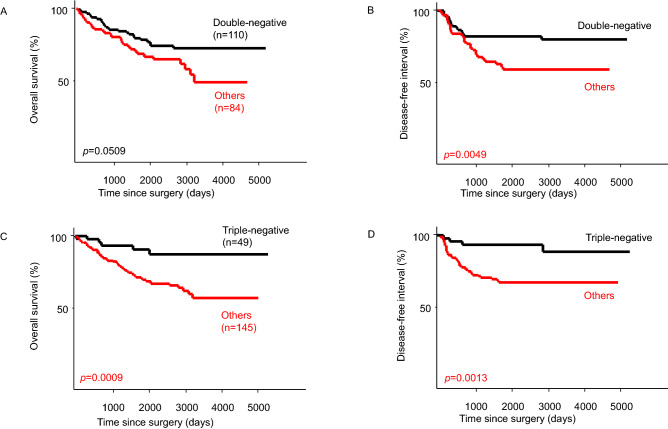
Figure 3.
Kaplan–Meier curves of overall survival (OS) and disease-free interval (DFI) of the double-negative (ALDH1A1-negative + CD133-negative) and triple- negative groups (CSC marker-negative + mutant p53-negative). (A) OS curves stratified by the double-negative group or others. (B) DFI curves stratified by the double-negative group or others. (C) OS curves stratified by the triple-negative group or others. (D) DFI curves stratified by the triple-negative group or others.

