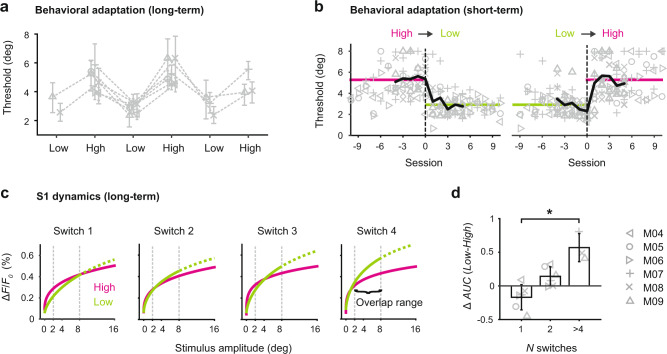
Fig. 4. Timescale of behavioral adaptation and related S1 dynamics.
a Long-term behavioral adaptation. Psychometric thresholds of individual mice (n = 6) undergoing repetitive task changes starting with either the high range or low range condition. Symbols represent mean thresholds across sessions (n = 5–11 per condition), error bars represent 95% confidence limits. Conditions are changed in an alternating fashion to test reversibility of adaptation. b Short-term behavioral adaptation at the transition (dashed lines) from high to low (left) and low to high (right). Symbols represent thresholds from each mouse and each session. Bold lines represent thresholds averaged across mice before and after the transition. Horizontal lines represent thresholds averaged across mice and sessions for a given condition. The data are normalized with regard to the transition, with session 0 representing the last session of the preceding condition. c S1 dynamics over multiple task changes (long-term). Neuronal stimulus-response curves derived from the ΔF/F0 measurement in S1. The curves are weibull fits to the data of n = 3 mice undergoing repetitive changes. The “overlap range” is defined as the stimulus range common to both high range and low range datasets (2–8 degree) which is used to calculate the area under the curve (AUC). The hypothetical part (above 8 degree for the low range) is represented as dashed curve. d Difference between high range and low range S1 responses, calculated as the difference in AUC space (Δ AUC (Low − High)) at different training stages. Bars represent means across mice with SD (not all mice underwent all switches; switch 1–2, n = 6 mice, switch >4, n = 3 mice). *P = 0.04, Kruskal–Wallis test.

