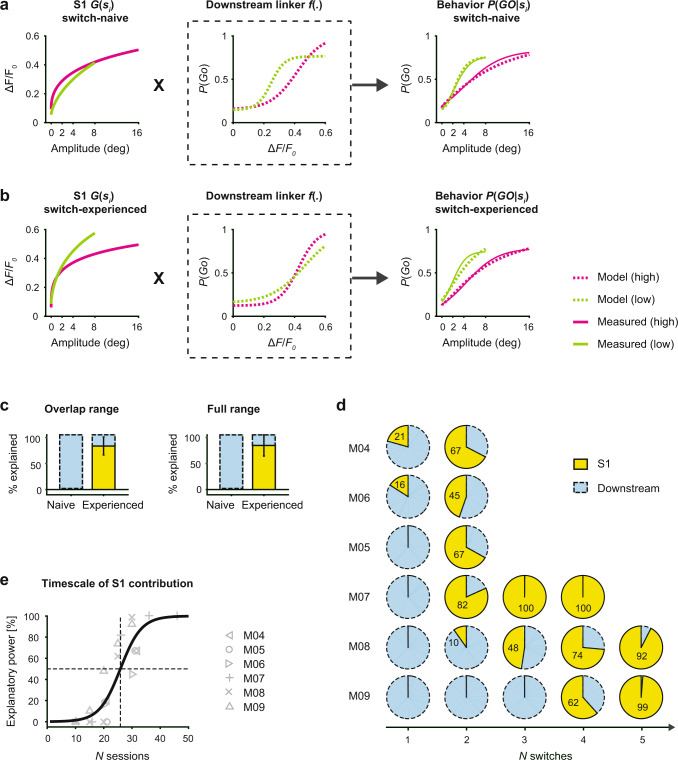
Fig. 5. S1 contribution to long-term behavioral adaptation.
a Model incorporating the sensory input distribution si, the neuronal response function G(si) derived from the GEVI signal in S1, and the behavioral readout P(GO│si). The function f(.) represents a downstream process, matching the evoked fluorescence to the lick response. Model predictions and measured data at the “switch-naive” training stage, when subjects are challenged with a change in stimulus statistics the first time. b Model predictions and measured data at the “switch-experienced” training stage, when subjects have undergone at least four switches. c Relative explanatory power in S1 of mice undergoing multiple changes. Model results are shown separately for the overlap range (left) and the full range (right). Bars represent means across mice with SD (n = 3). d Pie plots depict the fraction explained by S1 versus downstream quantified for the behavior of mice undergoing a different number of switches and different number of sessions per condition (M04, M05, M06, n = 2 switches, n = 10–11 sessions, M07, M08, M09, n = 4–5 switches, n = 5 sessions). e Timescale of S1 explanatory power. The fraction explained by S1 is plotted as a function of the number of sessions. Solid curve is a logistic fit to all data.

