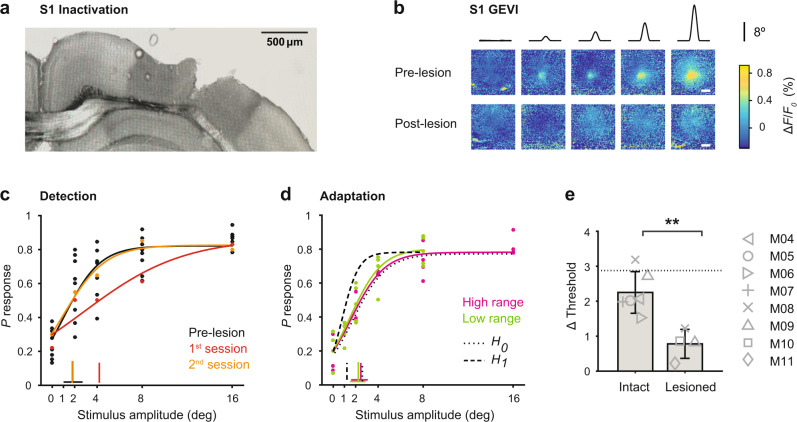
Fig. 6. The effect of S1 inactivation on behavior.
a Wide-field image of a coronal mouse brain section (100 μm, right hemisphere) with cytochrome oxidase staining, showing a S1 lesion upon acid injection (0.3 μL ibotenic acid 10 mg/mL). b Frames of cortical fluorescence activity from an example mouse before and after the lesion. Top. Example session with S1 intact, showing GEVI activity patterns in response to different stimulus amplitudes (high range, n = 25 trials per stimulus). Bottom. Example session of the same mouse after the lesion (n = 18 trials per stimulus). The GEVI activity pattern was used for targeted acid injections. c Psychometric curves and response thresholds for an example mouse detecting high range stimuli before and after the lesion. Each dot corresponds to response probabilities from a single session. Solid curves are logistic fits. Note: Pre-lesion data is shown for several sessions (n = 5) whereas the post-lesion data are shown separately for the first (red) and second session (orange) upon lesion. d Psychometric curves and response thresholds for the same mouse challenged with a change in stimulus statistics (high range to low range) upon S1 inactivation. Solid curves are logistic fits to the average data (n = 4–5 sessions). Otherwise, figure conventions are the same as in Fig. 3. e Behavioral adaptation is calculated as the change in psychometric threshold (Δ threshold) for healthy and lesioned animals. Bars represent means across mice with SD (n = 6 intact, n = 4 lesioned). The dotted line represents the mean across sham-operated mice (n = 2). **P = 0.01, two-sided Wilcoxon rank-sum test.

