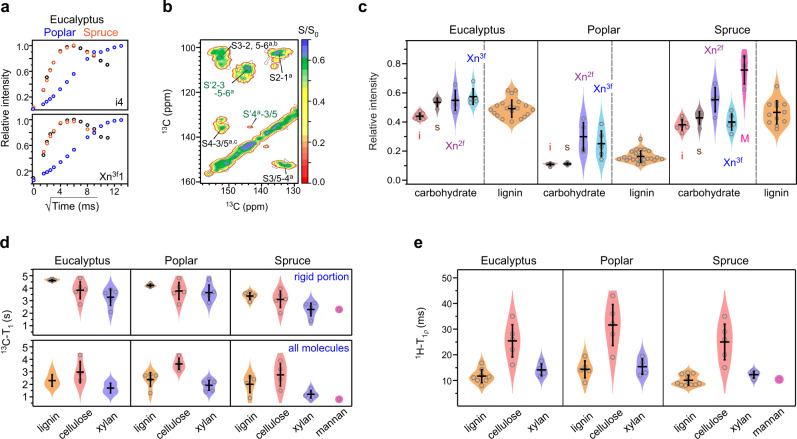
Fig. 4. Site-specific hydration and dynamic landscape of biomolecules.
a Representative water-to-biomolecule 1H polarization transfer buildup curves. The data of interior cellulose carbon 4 (i4) and three-fold xylan carbon 1 (Xn3f1) are compared across plants. Poplar has slow buildup due to the limited water contact. b Hydration map on top of a 2D spectrum plotting the ratio (S/S0) of water-edited intensity (S) to the equilibrium intensity (S0). A larger S/S0 ratio indicates better polymer hydration. c Distribution of the relative water-edited intensities (S/S0) of polysaccharides and lignin in eucalyptus, poplar, and spruce. Molecules with better water retention show higher water-edited intensities. Poplar is poorly hydrated. Relative intensities: n = 7, 4, 4, and 5 for i, s, Xn2f, and Xn3f, respectively. For lignin, n = 21, 23, and 12 for eucalyptus, poplar and spruce, respectively. n = 3 for the mannan in spruce. Source data are provided as a Source Data file. d 13C–T1 relaxation times of rigid (blue rectangles) and all molecules (colored as yellow, red, purple, and magenta for different molecules) in three woody plants, which represent nanosecond-timescale motions. 13C–T1 relaxation time constants: n = 5 for both cellulose and xylan in all three plants. For lignin, n = 5, 4, and 5 for eucalyptus, poplar and spruce, respectively. Source data are provided as a Source Data file. e 1H–T1ρ relaxation times reflecting microsecond timescale dynamics. 1H–T1ρ time constants: n = 5 for cellulose and n = 4 for xylan in all plants; n = 8, 5, and 11 for lignin in eucalyptus, poplar and spruce, respectively. The average value and standard deviation (error bars) are presented for each violin plot in panels c–e, the dataset of which are tabulated in Supplementary Tables 7–11. Source data are provided as a Source Data file.

