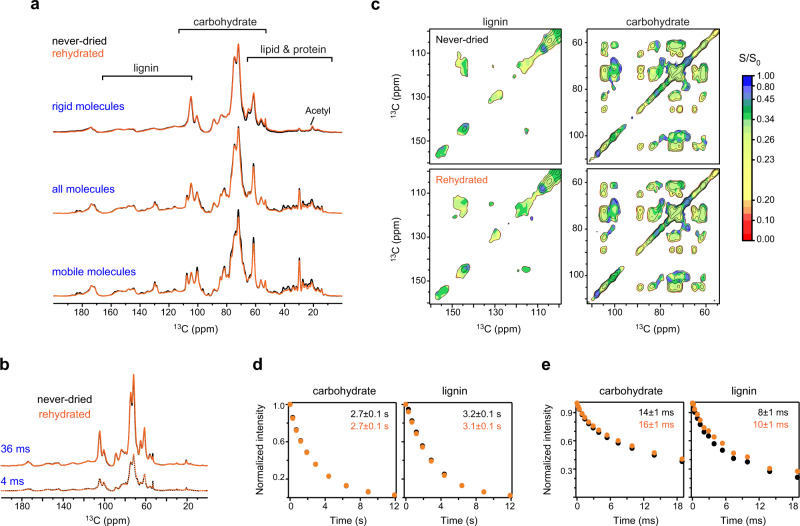
Fig. 5. Molecular-level dynamics and water association after dehydration and rehydration.
A never-dried spruce sample was first measured, and then freeze-dried and rehydrated for direct comparison. a Overlay of spectra collected using never-dried (black) and lyophilized and then rehydrated (orange) spruce stem samples showing high similarity for polysaccharides and lignin. From top to bottom are the CP, quantitative DP, and short recycle-delay DP spectra. The key regions of lignin, carbohydrate, and lipid are marked. b 1D water-to-carbohydrate polarization transfer spectra revealing similar water association for never-dried and rehydrated samples. The well-hydrated molecules are selected using a short 1H mixing time of 4 ms while the equilibrated state is measured using 36 ms 1H mixing. c Water-edited 2D hydration map showing comparable water-edited intensities (S/S0) for both lignin and carbohydrate regions in the never-dried and the rehydrated samples. The ratio (S/S0) is between the water-edited intensity (S) and the equilibrium intensity (S0). d Average 13C–T1 relaxation plot, using the integrals of spectral regions for carbohydrates (left) and lignin (right). Source data are provided as a Source Data file. e Average T1ρ relaxation of carbohydrates and lignin in never-dried (black) and rehydrated (orange) samples. Error bars are standard deviations of the fitting derived parameters. Source data are provided as a Source Data file.

