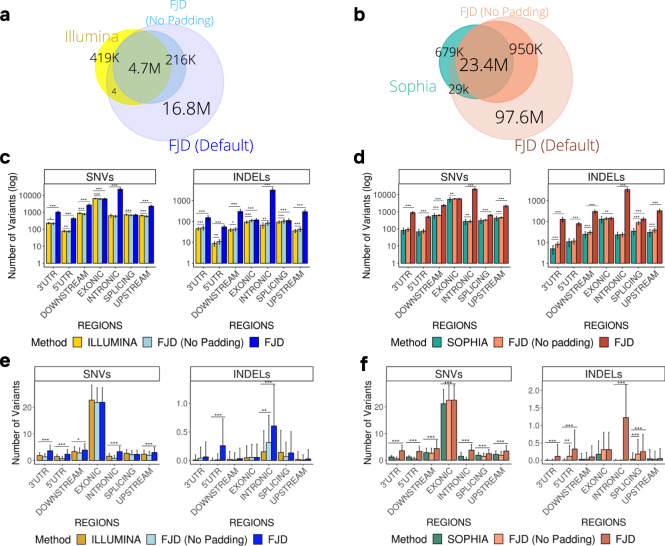
Fig. 2. Comparison of the performance of the FJD-pipeline and the commercial pipelines in the detection of variants in samples from the general cohort.
Venn diagrams showing the overlap of variants detected the commercial pipelines, (a) Illumina and (b) Sophia, and the FJD-pipeline (with and without padding applied). Bar plots represent the mean of the number of SNVs and INDELs detected in samples by (c) the Illumina-pipeline and the FJD-pipeline, and (d) the Sophia-pipeline and the FJD-pipeline, in different genomic regions. Bar plots show the average number of clinically relevant variants detected by (e) the Illumina-pipeline and (f) the Sophia-pipeline and the FJD-pipeline, in each type of genomic region. Clinically relevant variants are selected as those annotated by the ClinVar database as “pathogenic”, “likely pathogenic”, “uncertain significance” or a combination of just those categories, VUS are filtered by allele frequency (GnomAdg_AF_POPMAX < 0.1). The distributions are shown using the mean and standard deviation for visual ease. A t test was applied for the comparisons. Significant differences between values are indicated by asterisks: *p < 0.05, **p < 0.01, ***p < 0.001.

