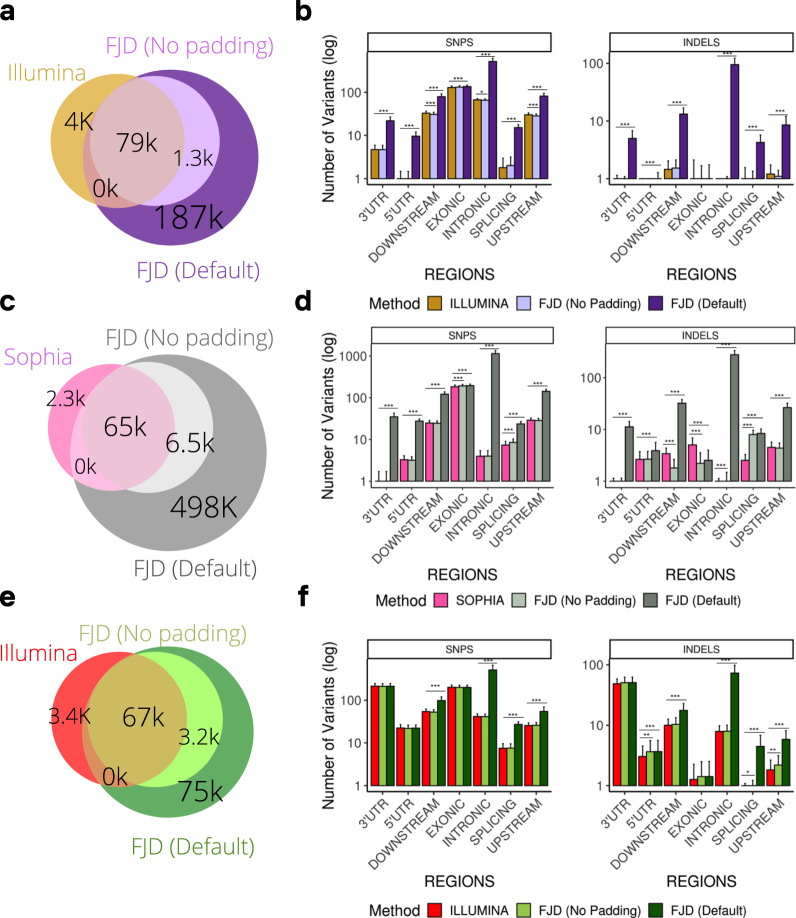
Fig. 3. Comparison of variants detected between the FJD-Pipeline and the commercial pipelines of Illumina and Sophia in the cancer and cardio cohorts.
Venn diagrams showing the overlap of variants detected between the FJD-pipeline and the commercial pipeline: (a) Illumina -TSCancer, (c) Sophia panel, (e) Illumina-Nextera panel. The bar plots show the average number of variants (variant count) detected by the FJD-pipeline and the commercial pipelines (b) Illumina-TSCancer Panel, (d) Sophia, (f) Illumina- Nextera Panel, in each type of genomic region, the distributions are shown using the mean and standard deviation for visual ease. Significant differences between values are indicated by asterisks: *p < 0.05, **p < 0.01, ***p < 0.001.

