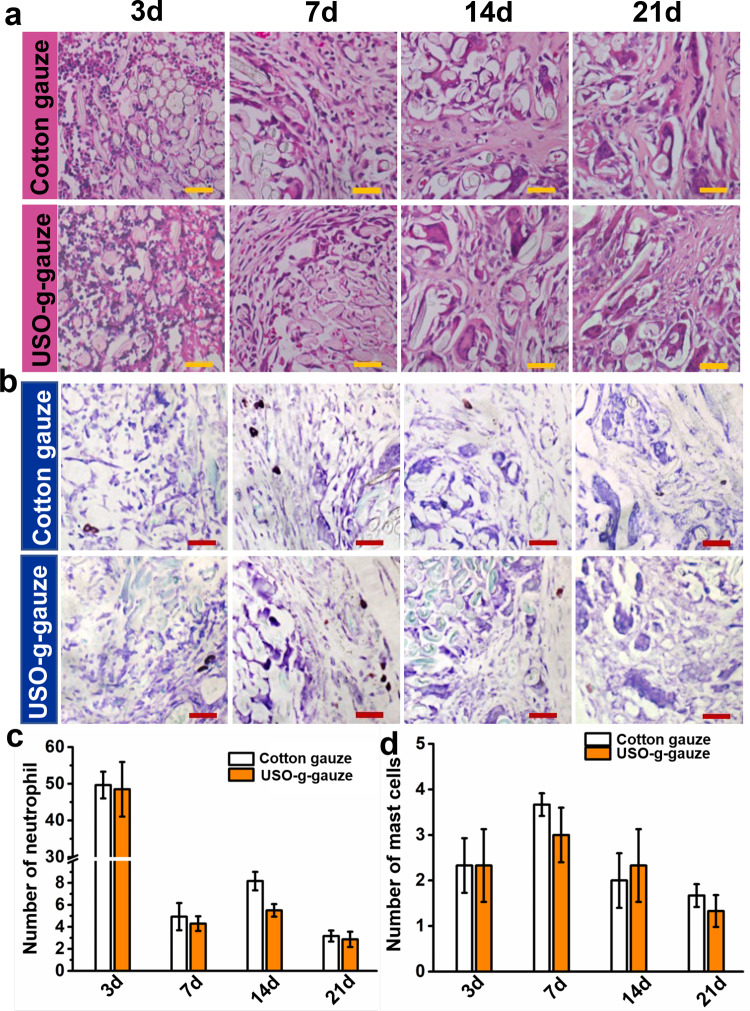
Fig. 9. Histological changes of the subcutaneous muscle tissue treated with gauzes.
a H&E staining, b toluidine blue staining sections of subcutaneous tissue surrounding the gauzes at varied time intervals in the muscle implantation experiments using rats. The corresponding numbers of: c neutrophil, and d mast cells at different time intervals. Data in c and d are shown as mean ± SD, n = 6, error bars represent SD. Source data for c and d are provided as a Source Data file. Scale bar: 40 μm.

