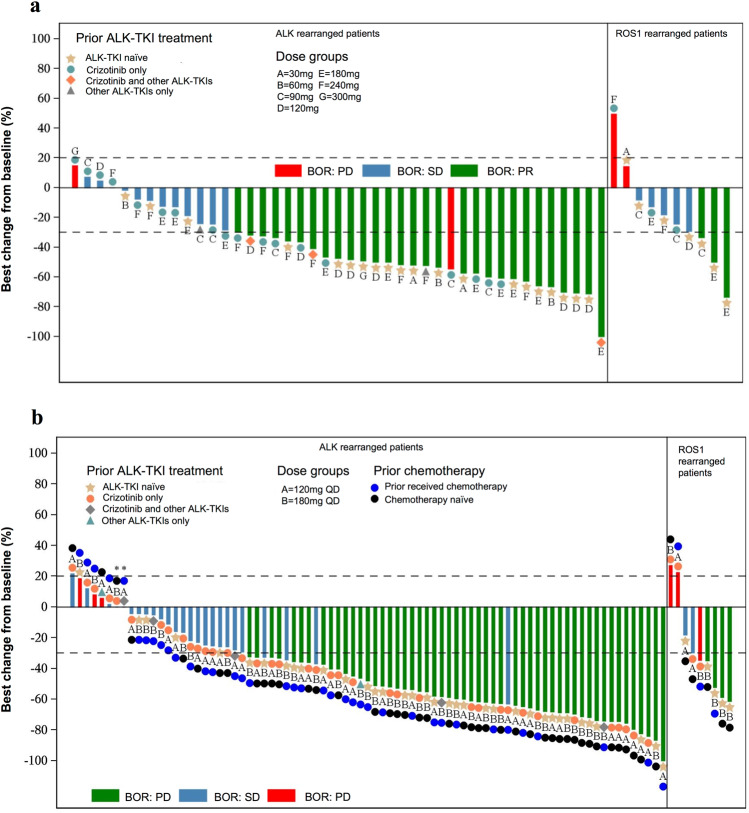
Fig. 2.
Best percentage change from baseline in target lesion size for patients in the a dose-escalation phase (n = 51) and b dose-expansion phase (n = 89). BOR best overall response, PR partial response, SD stable disease, PD disease progression, ALK anaplastic lymphoma kinase, ROS1 ROS proto-oncogene, receptor tyrosine kinase 1. *The percentage of best change from baseline was 0%. Note: Among 54 patients in the full analysis of dose-escalation phase, three patients did not have any efficacy assessment results. Two patients in the dose-escalation phase presented with both ALK and ROS1 rearrangement positive status, thus duplicately displayed in the waterfall plot. Therefore, a total of 53 bars for 51 patients are displayed in the waterfall plot a. Among 99 patients in the full analysis set of dose-expansion phase, 5 patients did not have any efficacy assessment results, 2 patients did not have measurable target lesion at baseline, and 3 patients did not have any efficacy evaluation results due to adverse events. One patient in the dose-expansion phase presented with both ALK and ROS1 rearrangement positive status, thus duplicately displayed in the waterfall plot. Therefore, a total of 90 bars for 89 patients are displayed in the waterfall plot b

