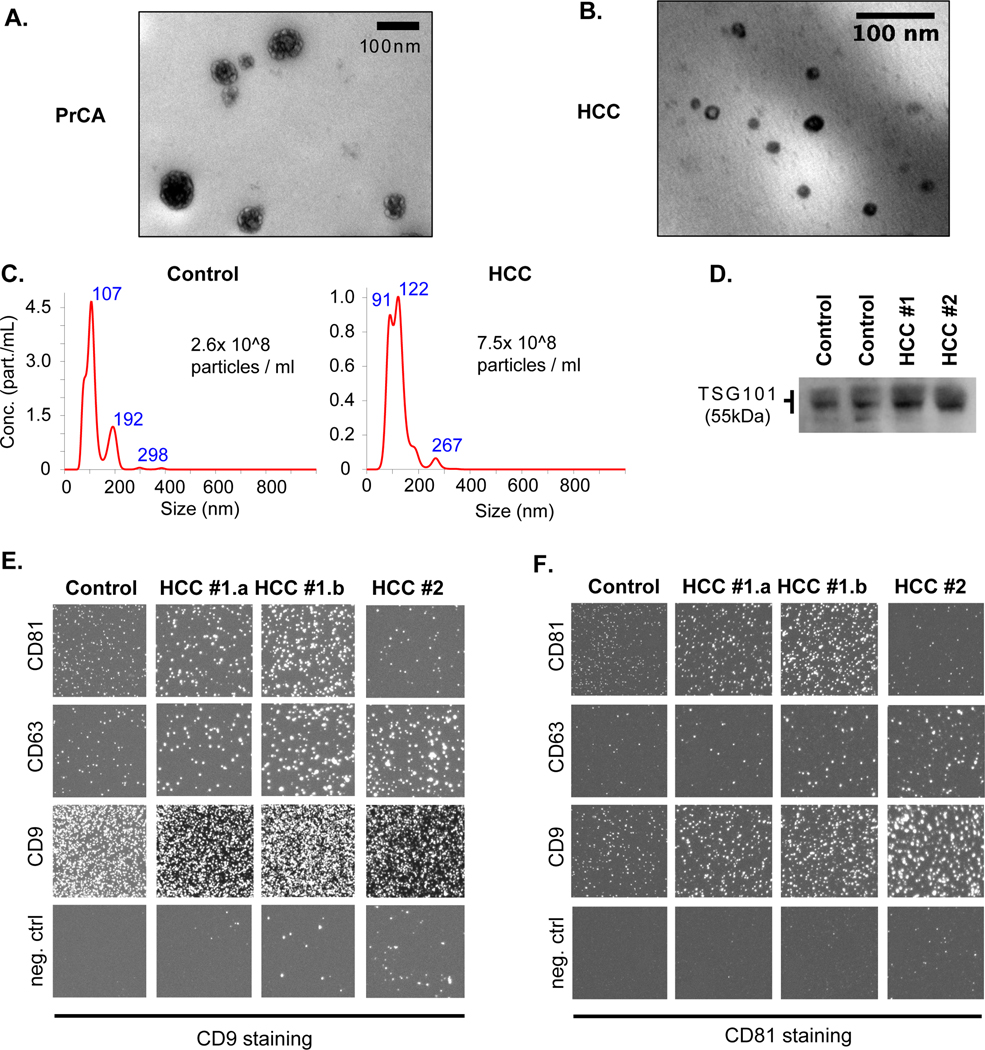
Figure 2. Quality assessment of EV enrichment process for exRNA extractions from human blood samples.
(A, B) Transmission electron microscopy image of prostate cancer serum isolate (A) and HCC plasma isolate (B). (C) Nanoparticle tracking analysis (Nanosight®) results in the plasma isolate of a control (left) and HCC patient (right) with corresponding size distribution and estimated particle concentration. (D) Western Blotting image of protein lysate from isolate against TSG101 (~55 kDa) in two control (left) and two HCC (right) patients. (E,F) Immunolabeling of the isolate with Exoview™. Isolates were captured by indicated antibodies (CD81, CD63, CD9, control IgG) on a chip and stained with CD9 (E) or CD81 (F) antibodies to visualize different EV subpopulations in one control and three HCC samples (#1.a and #1.b represent technical replicates from the same patient).

