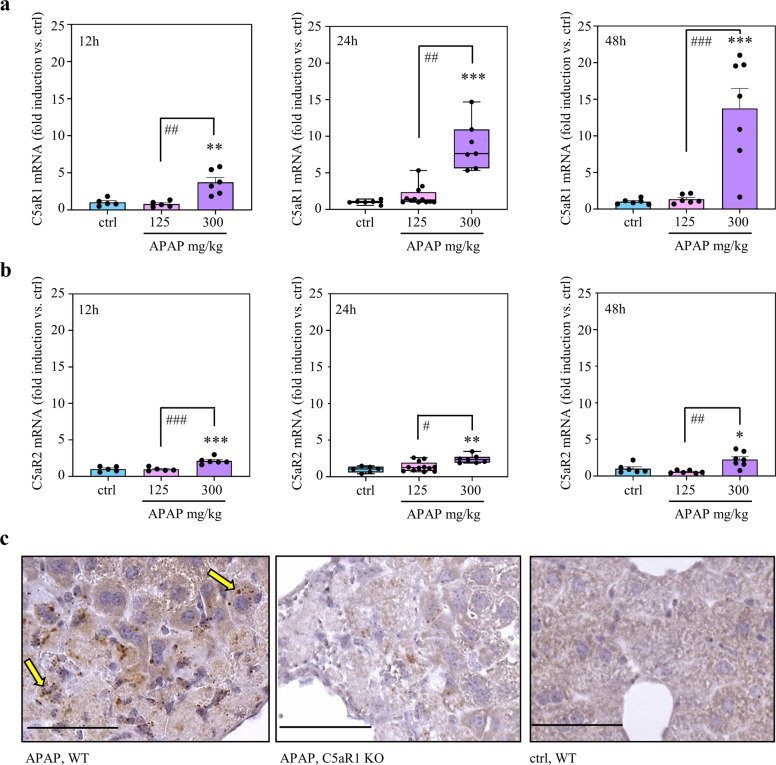
Fig. 3. Gene induction of c5ar1 during APAP-induced ALI.
a, b C57BL/6J mice received 0.9% NaCl (12 h, n = 5; 24 h/48 h, n = 6), APAP at 125 mg/kg (12 h, n = 5; 24 h, n = 12; 48 h, n = 6), or APAP at 300 mg/kg (12 h, n = 6; 24 h/48 h, n = 7). After the indicated time points, hepatic RNA was isolated. For controls and APAP at 300 mg/kg (24 h/48 h), individually analyzed RNA populations were the same that were used for pooling in MACE. Hepatic C5aR1 (a) and C5aR2 (b) mRNA was determined by real-time PCR at 12 h (left panel), 24 h (middle panel), or 48 h (right panel) after APAP administration. C5aR1 and C5aR2 mRNA normalized to GAPDH is shown as fold-induction compared to control of the same time point (*p < 0.05, **p < 0.01, ***p < 0.001 vs. control at the same time point; #p < 0.05, ##p < 0.01, ###p < 0.001). Statistical analysis on raw data: (a, b middle panel) Kruskal–Wallis test with Dunn’s post hoc test, data are shown as box-plots; (a, b left/right panel) ANOVA with Bonferroni post hoc test, data are shown as means ± s.e.m. c C57BL/6J C5aR1-deficient mice and their wild-type counterparts (n = 4 per group) received 0.9% NaCl (control) or APAP (300 mg/kg). After 30 h, hepatic C5aR1 mRNA was analyzed by in situ hybridization (RNAscope). Representative specimens are shown. Specimens underwent processing in parallel. C5aR1 positivity shows as fine-grained dark-brownish dots. C5aR1 mRNA expressing hepatocytes are exemplarily indicated as yellow arrows. Wild-type mice, WT; knockout mice, KO. Scale bars: 50 μm.

