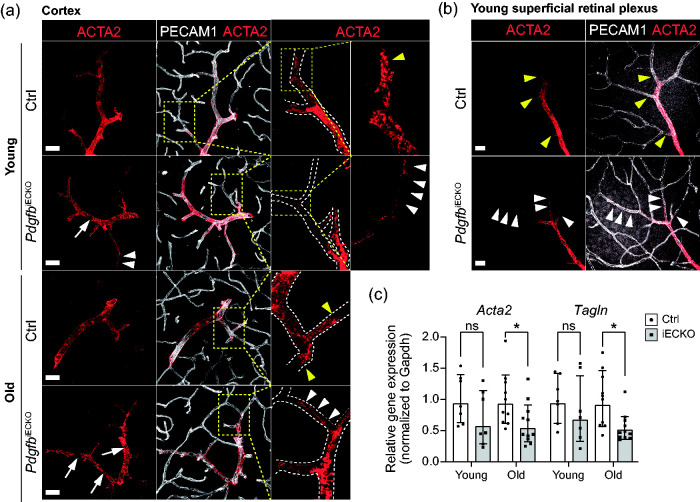
Figure 3.
Assessment of arteriolar VSMCs (aaVSMCs) in adult-induced PdgfbiECKO and littermate controls. (a) Representative images of aaVSMC in young (PdgfbiECKO n = 4, Ctrl n = 2) and old mice (n = 3): co-immunolabeling of ACTA2 (red) and PECAM1 (white). Scale bars 30 µm. Dashed inserts are magnified for detailed visualization of ACTA2 expression and aaVSMC morphology. (b) Representative images of aaVSMC in young retinas (PdgfbiECKO n = 4, Ctrl n = 3): co-immunolabeling of ACTA2 (red) and PECAM1 (white). Scale bars 25 µm. In a and b, white arrows indicate patchy loss of ACTA2 expression leaving small, empty gaps of aaVSMC coverage along the vasculature. Yellow arrowheads indicate ACTA2 positive terminal aaVSMC at the branching arterioles in Ctrl samples, where they appeared to end sharply while in PdgfbiECKO they were stretched out and elongated (white arrowheads). (c) qPCR analysis on the mural cell genes Acta2 and Tagln performed on freshly isolated brain microvascular fragments (for litter and n number see Supplementary Table 1). The genes of interest were normalized to endogenous Gapdh levels and they are presented as relative gene expression to Ctrl samples. c-Old (Tagln), Normality tests revealed that the data was unevenly distributed so nonparametric Mann-Whitney U test was used to evaluate significance. c-Young (Acta2, Tagln) and c-Old (Acta2), The significance of evenly distributed data was evaluated using unpaired 2-tailed t test with Welch’s correction. *p < 0.05, **p < 0.01, ***p < 0.001 and ****p < 0.0001, two-tailed student’s t-test. Data is presented as geometric mean with geometric SD.

