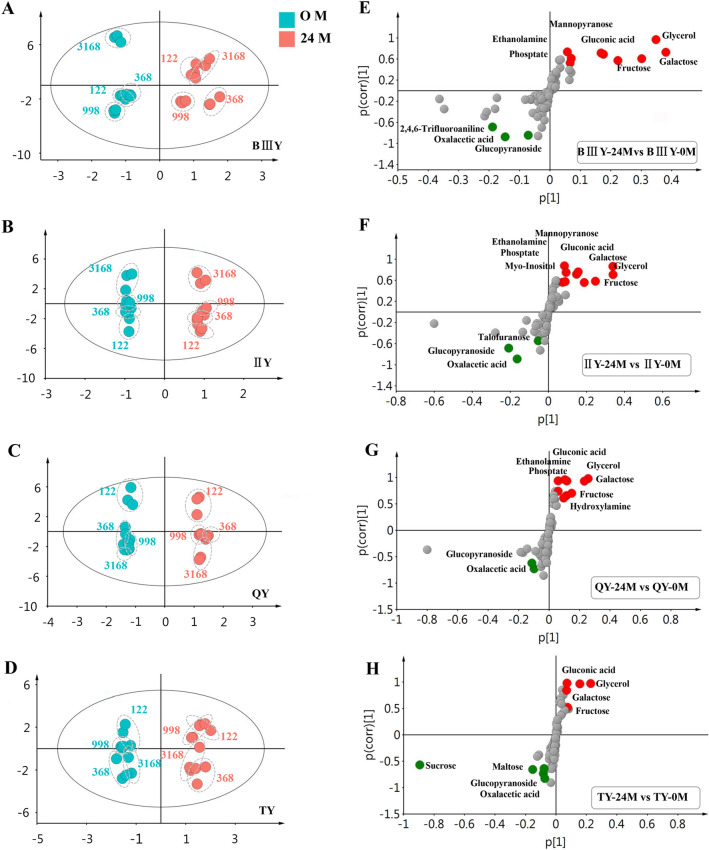
Fig. 3.
The score plots (A–D) and S-plots of the different metabolites (E–H) generated from pairwise OPLS-DAGC-MS data showing the distinct metabolomic changes among the BIIIY-122, BIIIY-998, BIIIY-368, BIIIY-3618 (A, E),IIY-122, IIY-998, IIY-368, IIY-3618 (B, F), QY-122, QY-998, QY-368, QY-3618 (C, G), and TY-122, TY-998, TY-368, TY-3618 (D, H). The significantly different metabolites with VIP > 0.5 and |p(corr)| > 0.5 have been labeled in the S-plot (B, D, F, H)

