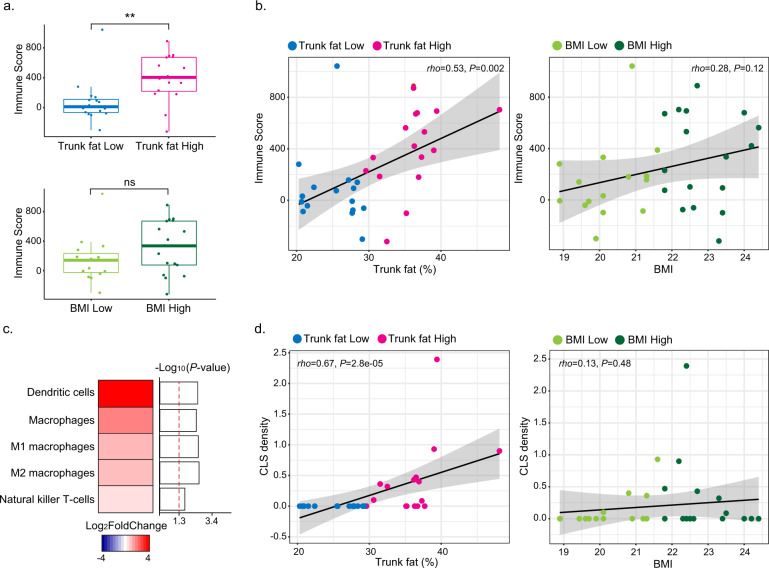
Fig. 2. Immune cell population changes in association with high vs. low trunk fat in normal BMI individuals.
a Immune score was calculated to observe overall immune cell population change with trunk fat and BMI. The difference was more significant when trunk fat was used as a parameter. For both trunk fat and BMI, the median value was used to divide the samples into two groups (n = 16/group). **P < 0.01; ns not significant. b Correlation between immune score vs. trunk fat percentage (left) or BMI (right). c Heatmap illustrating increased immune cell population in trunk fat high group when compared to the trunk fat low group. The red dashed line corresponds to P value of 0.05. d Correlation between CLS density vs. trunk fat percentage (left) or BMI (right). CLS density equals #CLS/cm2.

