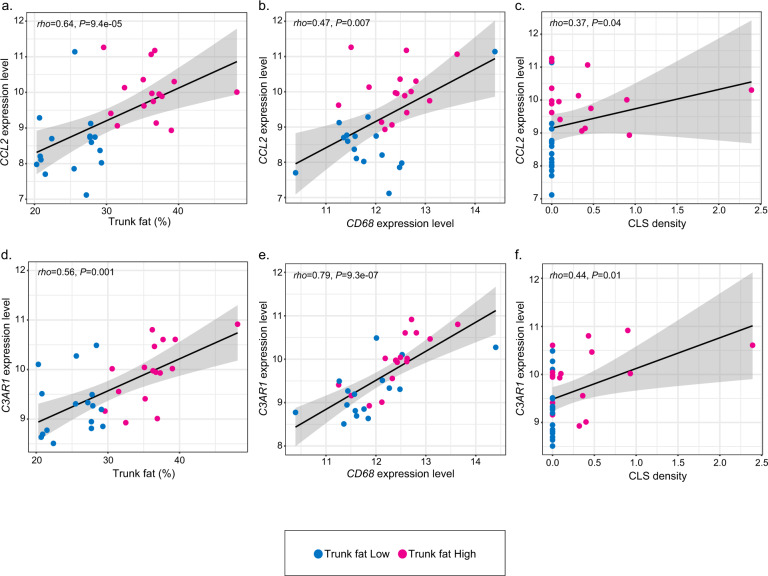
Fig. 3. Correlations between the levels of expression of genes that have a role in white adipose inflammation, trunk fat%, and CLS density.
a Correlation between trunk fat percent and CCL2 expression level. b Correlation between levels of CCL2 and CD68. c Correlation between CCL2 expression level and CLS density. CLS density equals #CLS/cm2. d Correlation between trunk fat percent and C3AR1 expression level. e Correlation between levels of C3AR1 and CD68. f Correlation between C3AR1 expression level and CLS density. CLS density equals #CLS/cm2.

