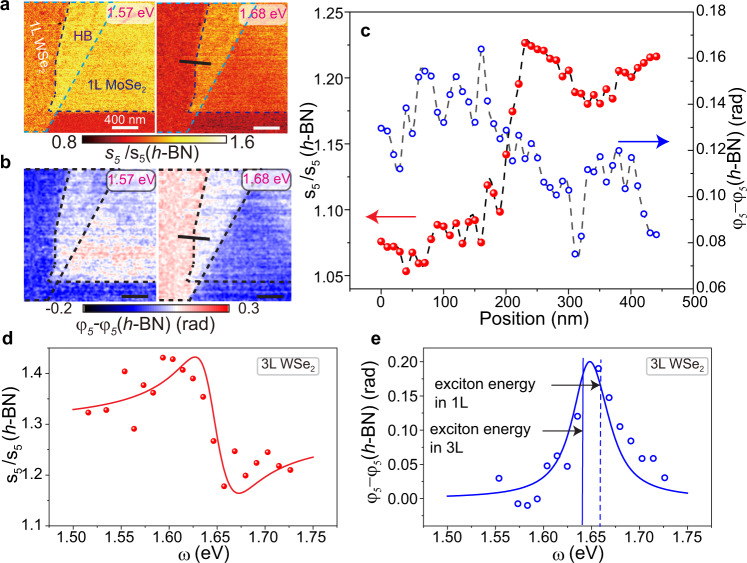
Fig. 4. Screening length of excitons in heterostructure and the effect of hybridization on the exciton resonance in WSe2 trilayer.
a, b Near-field images of the normalized amplitude and phase . The images in the left and right panels were taken at 1.68 eV (around the monolayer WSe2 exciton resonance energy) and 1.57 eV (around monolayer MoSe2 exciton resonance energy), respectively. The boundaries of the materials are displayed with dash lines. The scale bars indicate 400 nm. c Line profiles of the normalized amplitude and phase across the monolayer and heterobilayer along the black lines in the right panels in (a and b). d, e Normalized scattering amplitude and phase spectra for WSe2 trilayer (data points). The near-field data are fitted by the point dipole model (solid curves). The vertical blue dashed and solid lines in e are used to mark the exciton energies of WSe2 monolayer and WSe2 trilayer extracted from the point dipole model, respectively.

