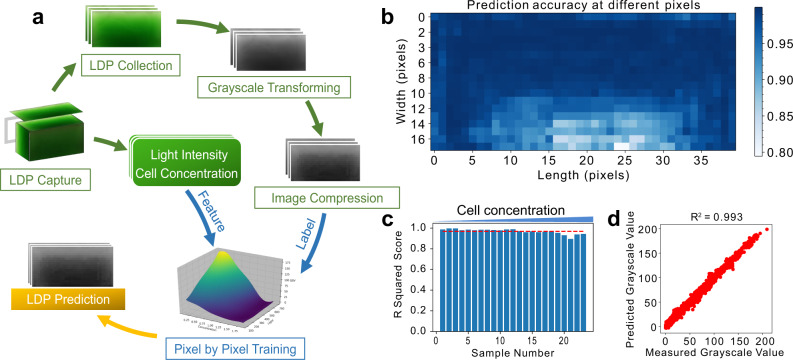
Fig. 1. Data processing and machine learning.
Data pre-processing (Green arrows), machine learning training (Blue), and prediction process (Orange) are shown in a. Light distribution patterns (LDPs) inside a PBR with varied cell concentrations under different light intensities are captured and transformed to grayscale images, followed by compression to 40 × 18 pixels. The light intensities and cell concentrations, as well as the corresponding 40 × 18-pixel LDPs, are used as features and labels, respectively, in the machine learning training. In order to achieve accurate prediction, the training and prediction are performed pixel by pixel. b Pixel-by-pixel R2 evaluation of LDPM prediction over testing samples suggests LDPM performs well at the majority of pixels. Evaluation over all pixels on testing LDPs showed an R2 score of 0.993 (d), further verifying the accuracy of the LDPM. c linear regression shows near-linear correlation between GSV and light intensity across all cell concentrations (average R2 score at 0.969), suggesting the grayscale value is a legitimate representation of light intensity. Cell concentrations from left to right are 0.11973, 0.21294, 0.40872, 0.45162, 0.54405, 0.62712, 0.74256, 0.82056, 0.90948, 0.96915, 1.10604, 1.2246, 1.3026, 1.3923, 1.443, 1.5444, 1.7901, 1.9188, 2.0241, 2.3556, 2.535, 2.9601, and 3.6777 g/L. Source data are provided as a Source Data file.

