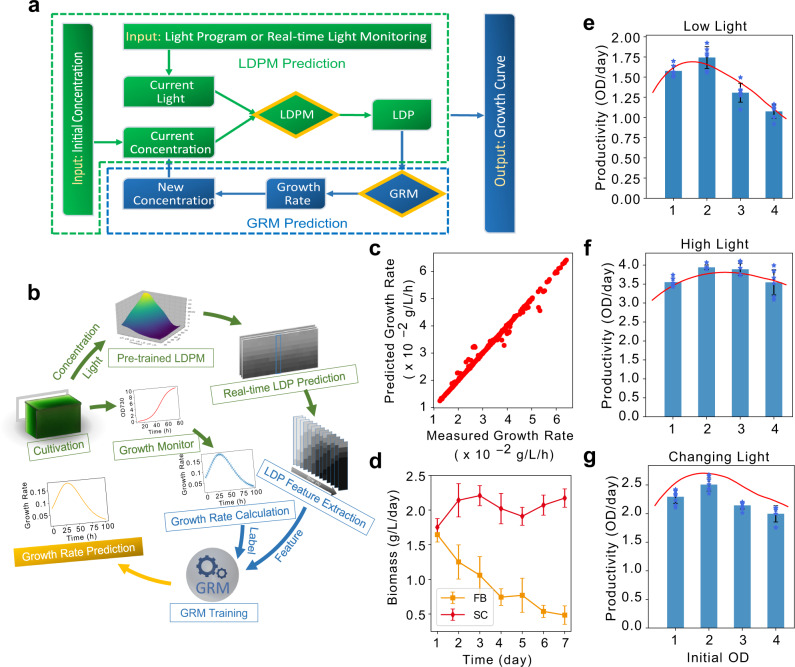
Fig. 2. Growth rate prediction, growth simulation and semi-continuous algal cultivation (SAC).
Overview of workflows for growth simulation and GRM training are shown in a and b, respectively. The growth simulation could be achieved by integrating the LDPM (Green) with an additional growth rate prediction model, GRM (a, Blue). The LDP features predicted by LDPM and corresponding growth rates calculated from growth curves were used as features and labels, respectively, in the GRM training (b). The accuracy of GRM prediction was evaluated and shown in c, with an R2 score of 0.992, indicating high precision. The cyanobacterial growth (biomass production) with different initial OD under low light (e), high light (f), and changing light (g) were simulated (red lines) and monitored (blue columns). The similar trends between simulations and measurements verified the accuracy of the simulation and legitimized the simulation as a reliable tool to inform algal cultivation system development. After light condition optimization, biomass productivity from machine learning-informed SAC was evaluated, with fed-batch as control. The biomass productivities sustain at around 2 g/L/day over 7 days in SAC (d, SC) while they decreased over time in fed-batch (d, FB). Original data points of bar figures (e–g) are shown on the plot with blue stars. Data are presented as mean values ±standard deviations (n = 3 independent samples with three technical replicates). Source data are provided as a Source Data file.

