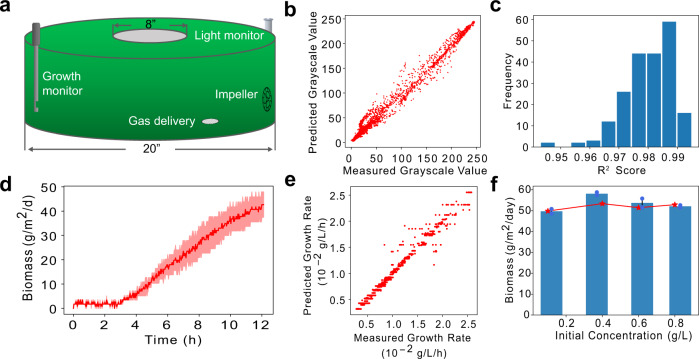
Fig. 6. Scaling-up of SAC with a pond system.
The pond system design is shown in a. b and c show the prediction evaluation of the adapted LDPM for the pond system. The LDPM achieved an overall R2 score of 0.986 (b) and pixel-by-pixel analysis suggested that prediction at all pixels were reasonably good, with a minimal R2 score of 0.943 (c). d, biomass production with the outdoor pond system. e, prediction evaluation of the GRM adapted for a pond system. f, machine learning-based growth simulation (red line) suggested that setting the initial cell concentration to around 0.4 g/L achieves optimal biomass productivity under the growth condition mimicking Texas Summer, which was well supported by the measured results (blue bars). Original data points are shown on the plot with blue dots. Error bands represent standard deviations (n = 2 independent samples). Source data are provided as a Source Data file.

