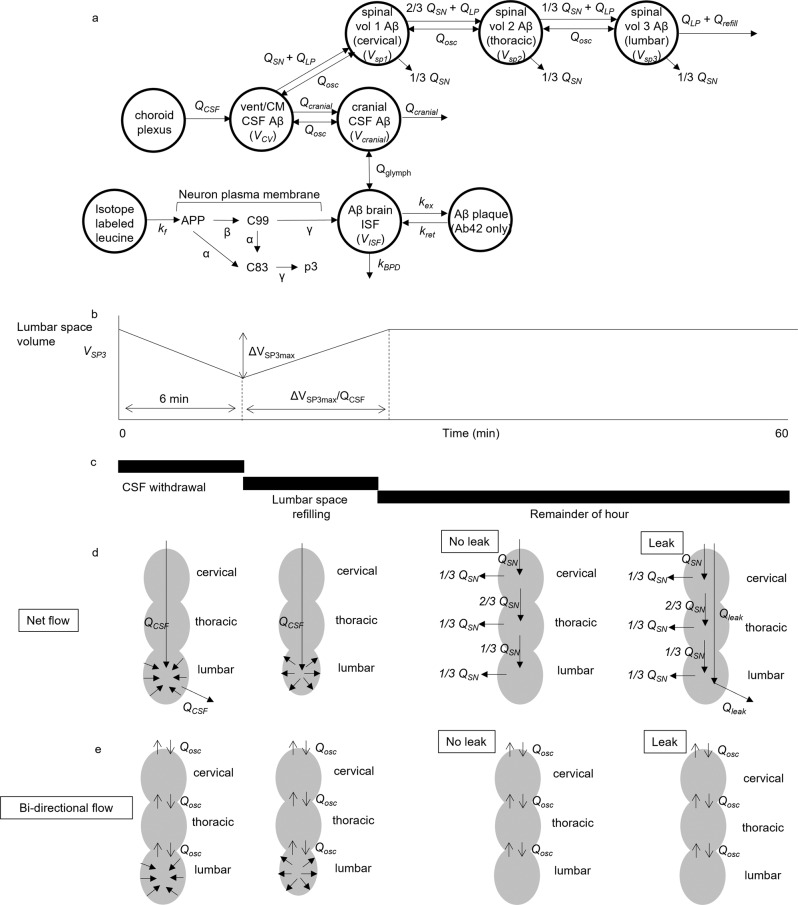
Fig. 1. Model of Aβ production, transport, and clearance.
Physiological model of CNS during SILK study, incorporating fluid flows, ISF and CSF compartment volumes, and Michaelis–Menten kinetics for Aβ production. a Model structure. b Flows in the spinal SAS due to hourly CSF withdrawal. The volume of the lumbar SAS decreases when the CSF withdrawal rate QLP exceeds the CSF production rate (QCSF) and subsequently refills with CSF to its original volume. c Timeline of hourly CSF withdrawal. d Net flow in the spinal SAS. e Bidirectional flow in the spinal SAS.

