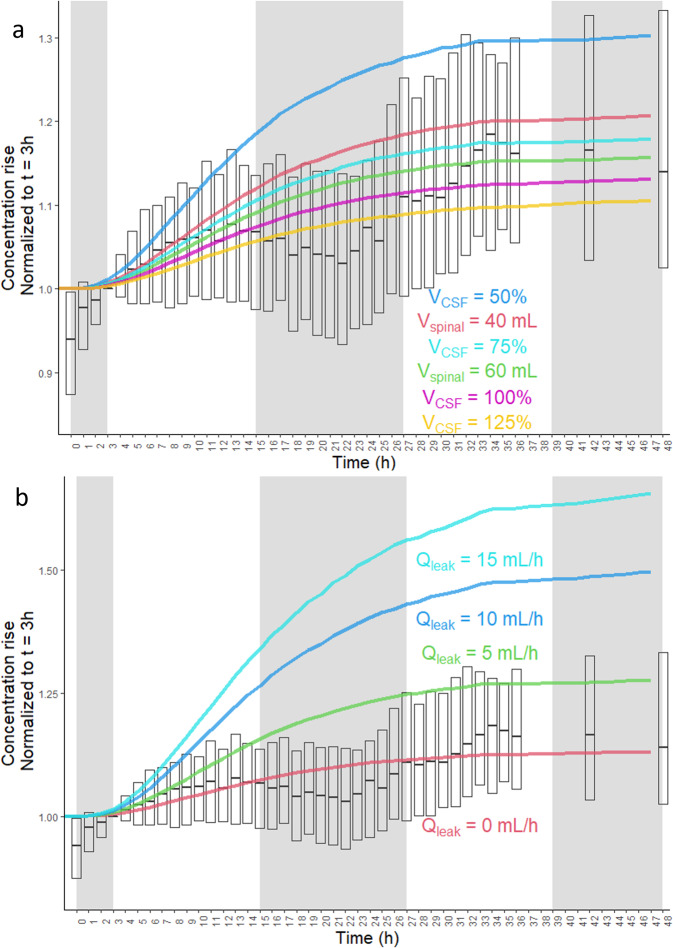
Fig. 2. Increasing lumbar Aβ CSF concentration due to hourly CSF withdrawal.
Normalized lumbar CSF concentrations of Aβ peptides averaged over all subjects (n = 96). Lumbar CSF Aβ concentration time courses for each subject were first normalized to time = 3 h to account for the sleep effect from the previous night (experiments started at 8 a.m.). The Aβ concentration was the average of Aβ38, Aβ40, and total Aβ for each subject (total Aβ was from an immunoprecipitation with an antibody recognizing a sequence common to Aβ38, Aβ40, and Aβ42). Some subjects (n = 17) only had concentration timecourse measured by ELISA for Aβ40 and Aβ42. The ELISA time courses were averaged for these two peptides at each time point. a The total volume of CSF (VCSF) was scaled between 50 and 125% in separate simulations, and the volume of spinal CSF was varied from 40 to 80 mL. b The presence of a CSF leak around the catheter was also simulated, ranging from 0 to 20 mL/h, or equal to the entire CSF production rate (Qleak = QCSF). Medians and means of measurements are shown, and bars represent the interquartile range. Shaded areas represent the sleep effect. Simulations of CSF leaks equal to 20 mL/h or QCSF overlapped with Qleak = 15 mL/h. For the full boxplot of measured concentrations, see Supplementary Fig. 1.

