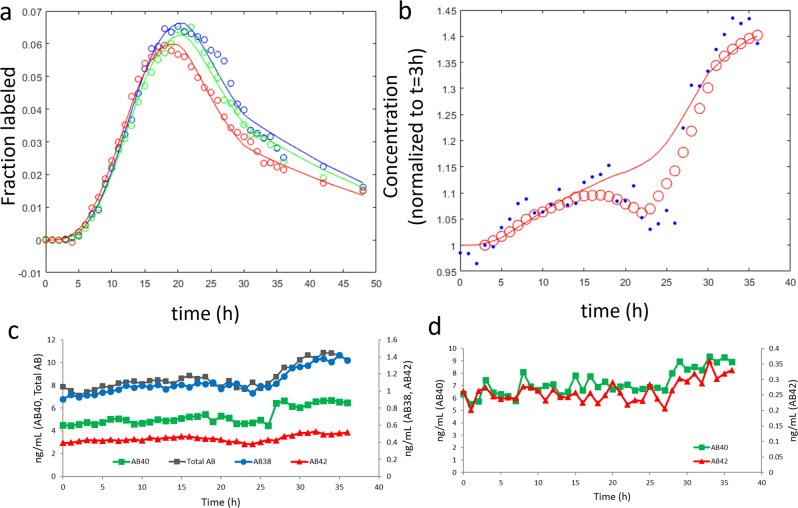
Fig. 3. Example of model fits to SILK and lumbar Aβ concentration.
The physiological model fits with step changes in Qleak at 3 h and 20 h for a single amyloid-positive subject. a Fit of the physiological model to SILK data. Blue = Aβ38, green = Aβ40, red = Aβ42. b Fit of lumbar CSF concentration data (0 < time < 3, Qleak = 8 mL/h; 3 < time ≤ 20 h, Qleak = 0 mL/h; 20 ≤ time < 30 h, Qleak = 13 mL/h; time ≥ 30 h, Qleak = 0 mL/h). Blue circles = mass spectrometric measurements normalized to time = 3 h. Red circles = moving mean smoothed data. c Lumbar CSF concentrations were measured by immunoprecipitation followed by quantitative mass spectrometry, showing the abrupt change in concentration at about 27 h for all four peptides measured. d Lumbar CSF concentrations measured by ELISA also showed an abrupt change at about 27 h for both peptides measured.

