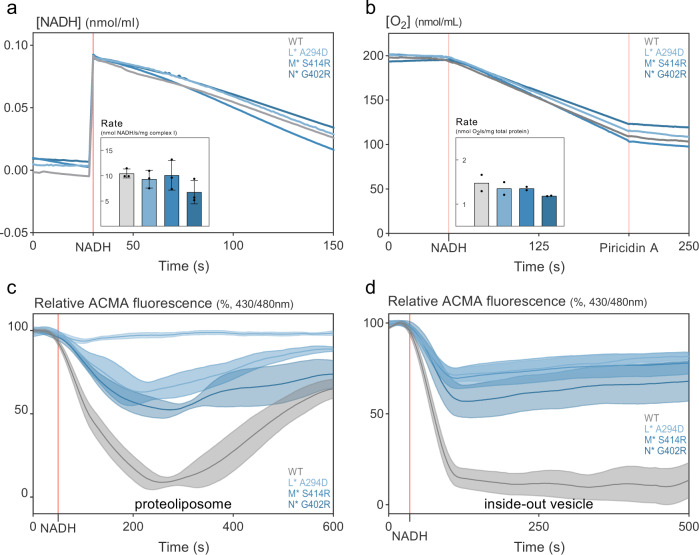
Fig. 3. High persistence-conferring nuo* variants are impaired in proton translocation.
a Complex I variants show similar NADH/decyl ubiquinone oxidoreductase activity as the wild-type complex. Complexes were reconstituted in liposomes and NADH concentration was monitored at 340 nm (one representative of n = 3). Average linear rates of NADH oxidation per mg complex I after NADH addition (inset, means ±stdev, n = 3) were not different (one-way ANOVA). Accounting for reconstitution efficiency, orientation, and activity of empty liposomes (see “Methods”), these rates amount to an overall NADH/decyl ubiquinone activity of 2.7 U mg−1, which is comparable to literature154. b The Nuo* variants and the wild-type complex transport electrons from NADH into the ETC with similar efficiency. Respirometry using a Clark-type electrode with membranes comprising complex I or its variants was used to measure the reduction of O2 by electrons which were released from NADH by complex I (one representative of n=2). Average linear rates of O2 consumption per mg protein after NADH addition (inset, means) were not different (one-way ANOVA) and amount to an overall NADH oxidase activity of 0.16 U mg−1, which is comparable to literature154. The second red vertical line indicates addition of piericidin A (10 µM), a potent complex I inhibitor, which indicates that O2 reduction indeed originates from NADH oxidation by complex I and that variants and wild-type complex I are equally sensitive to this inhibitor. c, d Proton translocation is impaired in all variants as estimated from the difference in fluorescence quenching of the pH-sensitive fluorophore ACMA in c proteoliposomes containing reconstituted complex I and in d ISOVs generated from membranes (means ±sems; n = 3). Relative fluorescent values were obtained by comparing the fluorescence to the start and through rescaling between 0 and 100% where 100% is the maximum value of each sample and 0% is the lowest value of the run (i.e. wild-type complex I which showed ±50% quenching, similar to values found in literature154). Proteoliposomes are leaky and therefore revert the ACMA quench over time. ISOVs, while additionally showing the activity of the terminal oxidases, are much tighter and show no reversion. In a, d, reactions were started by adding NADH (first red vertical line) and individual graphs are nudged horizontally and, in a, b also vertically to allow comparison. See also Supplementary Fig. 3. Source data are provided as a Source Data file.

