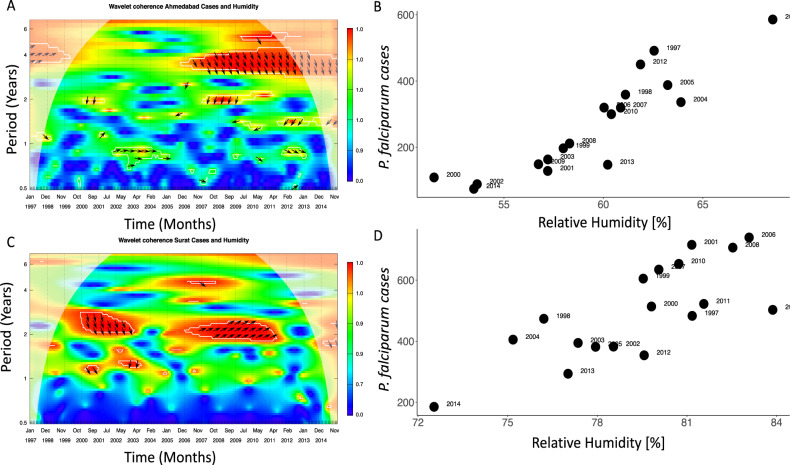
Fig. 1. Temporal association of malaria cases and relative humidity.
A–C The cross-coherence wavelet spectrum between humidity and monthly malaria cases in Ahmedabad (A) and Surat (C). Cross-coherence varies between 0 and 1 in a color scale from blue to red with the lines indicating 5% significance levels. Only regions within these lines exhibit significant cross-coherence at those levels. The shaded region corresponds to periods and times that are affected by the boundaries and are outside the so-called cone of significance. (The RH time series have been previously filtered with a low-pass filter to remove seasonality and therefore periods below 1 year, and to therefore focus on interannual variability, Fig. S16). B–D The total cases during the transmission season from August to November are shown as a function of average RH in a critical window preceding this season from May to July for Ahmedabad (B) and March to July for Surat (D). (The corresponding Pearson correlation values are R = 0.72 and 0.69).

