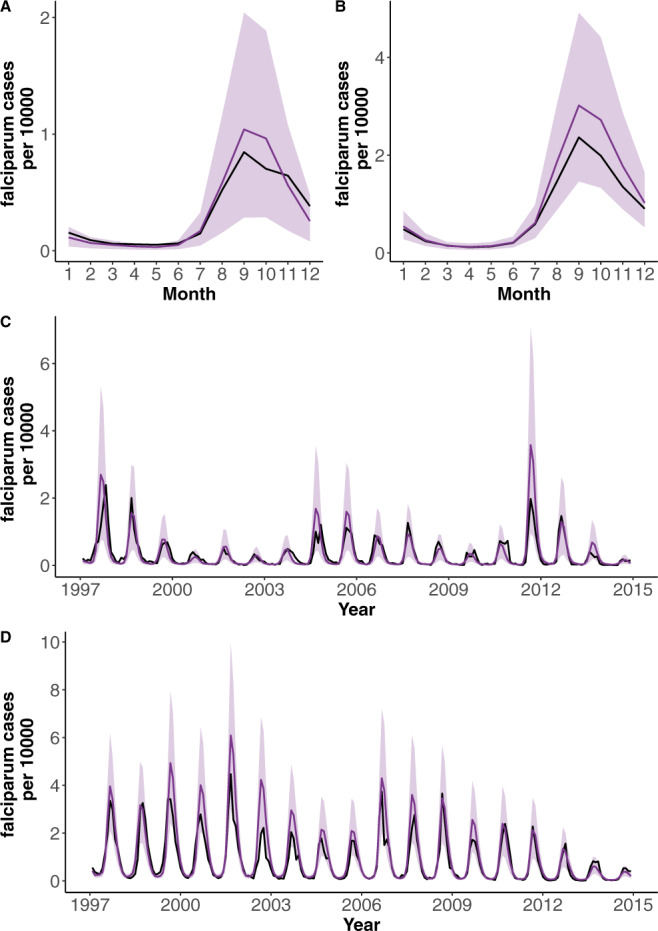
Fig. 2. Comparison of observed and simulated monthly cases with the best model for both cities.

Time series and seasonality for the observed cases (black) and the mean of 1000 model simulations (purple) for the two cities. The intervals between the 10% and 90% percentiles of the simulated data are shaded in light purple. Seasonality is shown in (A) for Ahmedabad and in (B) for Surat; the monthly time series are shown in (C) for Ahmedabad and in (D) for Surat. The simulated cases are not next step predictions but the predicted values from forwarding simulations of the model for the whole 20 years’ study period starting with estimated initial conditions. The estimation framework considers both types of noise: process noise to account for “environmental” stochasticity in the transmission process and observational noise as encoded in a measurement model.
