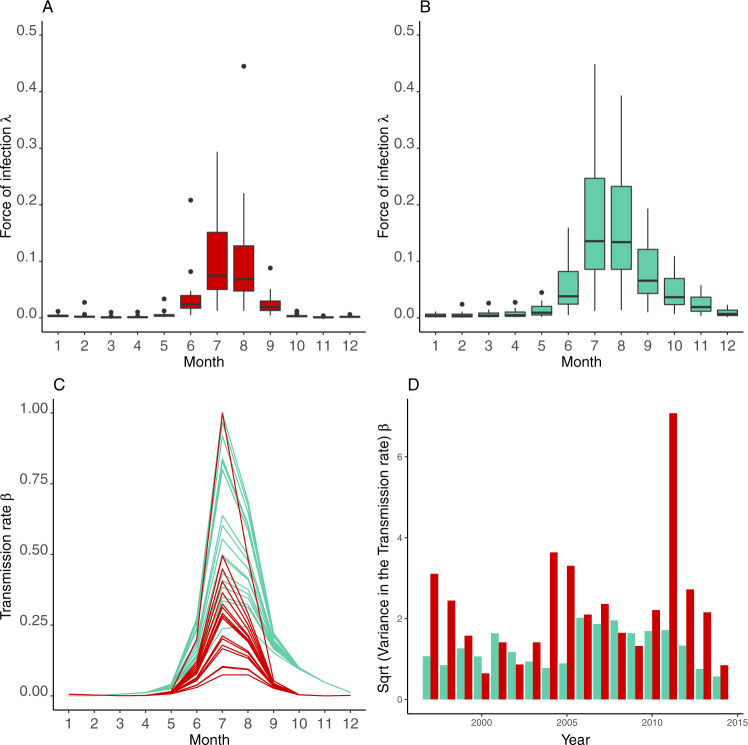
Fig. 3. Estimated transmission rate and force of infection in the two cities.
Monthly average force of infection and transmission rate from one representative simulation for the period 1997–2014 in Ahmedabad (red, A, C, D) and in Surat (green, B, C, D). The respective box plots of the force of infection by month per city are shown in (A) and (B) (computed for n = 1000 simulations and with the standard illustration of the minimum, 25th percentile, median, 75th percentile, and maximum). The force of infection equals the transmission rate () times the number of infected individuals and therefore measures the per capita rate at which susceptible (non-immune) individuals become infected. C The corresponding monthly transmission rate for each year for Ahmedabad (in red) and Surat (in green), which includes in the model the effect of humidity. D The corresponding variance in the force of infection is calculated within each year.

