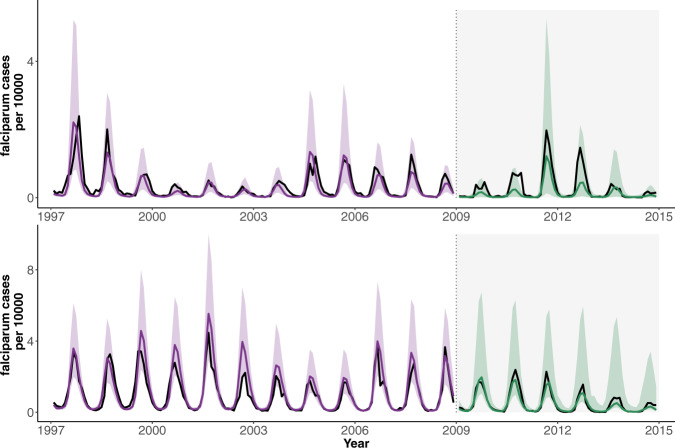
Fig. 4. Malaria prediction.
The median predicted cases from 1000 simulations are shown (in purple and green) for Ahmedabad (top) and Surat (bottom) together with the observed cases (in black). Corresponding shaded purple or green intervals show the 10–90% quantiles of the predicted distribution of cases for each month. Vertical dotted lines and corresponding background shading indicate two different kinds of model simulations and respective predictions: (1) For the initial period (light background), the model is simulated from 1997 forward until 2009. Thus, the comparison to data here is not based on the typical next-step (next-month) prediction (for which it can often be somewhat trivial to capture the fitted data), but on predictions that span more than a decade starting from estimated initial conditions in 1997. (2) The latter period (gray background) shows predictions for “out-of-fit” years (not used to fit the model), with simulations spanning the whole year and starting each January from the estimated state variables of the system. Predicted median cases capture the interannual variability of the data, and observations fall within confidence intervals (for 76% of the months). The estimation framework considers both types of noise: process noise to account for “environmental” stochasticity in the transmission process and observational noise as encoded in a measurement model.

